
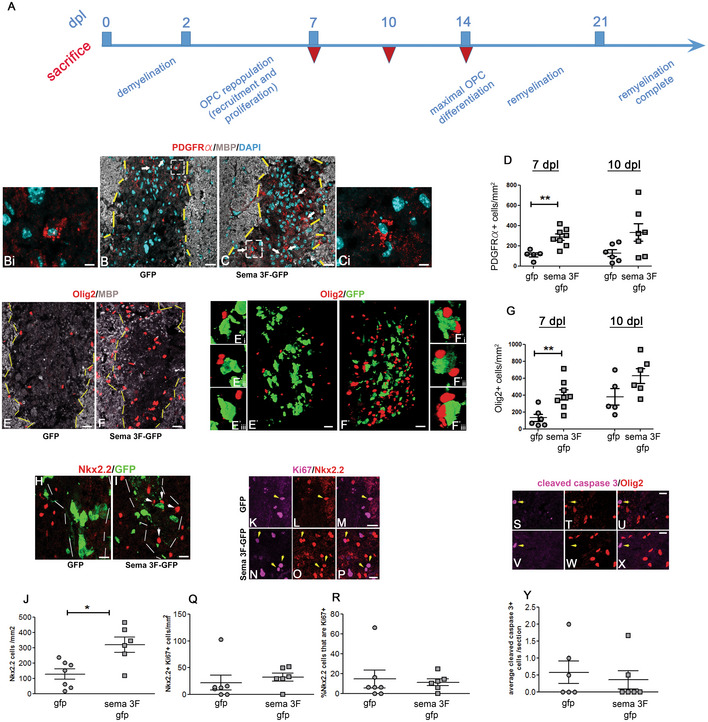
Figure 6. OPC recruitment is increased in Sema3F chimeras.
-
ATemporal sequence of events in LPC lesion. Dpl days post‐lesion. Red inverted triangles indicate sacrifice.
-
B–GLesions at 7 dpl in GFP (B, E) and Sema3F (C, F) mice. (B–C) Co‐labeling for PDGFRα, MBP, and DAPI. Arrows indicate OPCs in the lesion. Bi and Ci insets of white dotted squares in (B and C). (D) Higher numbers of PDGFRα+ (OPCs) cells in Sema3F mice at 7 dpl (Mann Whitney test: P = 0.0031, n = 6–8 mice/group). (E, F) Co‐labeling for Olig2 and MBP. (E′–F′) Co‐labeling for Olig2 and GFP of the lesions shown in (E–F). 3D reconstructions. Proximity of OPCs and Sema3F‐carrying cells. E'i‐E'iii and F'i‐F'iii insets of E′–F′. (G) Higher numbers of Olig2+ (oligodendroglial) cells in Sema3F‐GFP mice at 7 dpl (Mann–Whitney test: P = 0.0047, n = 5–8 mice/group). **P < 0.01.
-
H, IImmunolabeling for activated OPC marker Nkx2.2.
-
JNumbers of Nkx2.2+ cells are increased in lesions of Sema3F‐GFP mice at 7dpl (Mann–Whitney test: P = 0.014, n = 6–7 mice/group). Arrows indicate Nkx2.2+ cells in close proximity to GFP+ cells. Mean ± SEM. *P < 0.05.
-
K–PCo‐labeling for Nkx2.2 and proliferation marker Ki67. Arrows indicate double‐labeled cells. Q. Numbers of Nkx2.2+Ki67+ cells are increased at 7 dpl in Sema3F‐GFP mice. Mean ± SEM. n = 6–7 mice/group.
-
RThe proportion of Nkx2.2+ cells co‐expressing Ki67 is unchanged. Mean ± SEM. n = 6–7 mice/group.
-
S–XCo‐labeling for Olig2 and cleaved caspase 3; marker of apoptosis indicates occasional apoptotic cells in both groups of mice that are Olig2 − . Arrows indicate cleaved caspase 3+ cells.
-
YNumbers of cleaved caspase 3+ cells are the same in the two groups. Mean ± SEM. n = 6 mice/group.
Data information: Scale bars 20 μm (B, C, E, F), 10 μm (H, I, M, P, U, X), and 5 μm (Bi, Ci).
Source data are available online for this figure.