
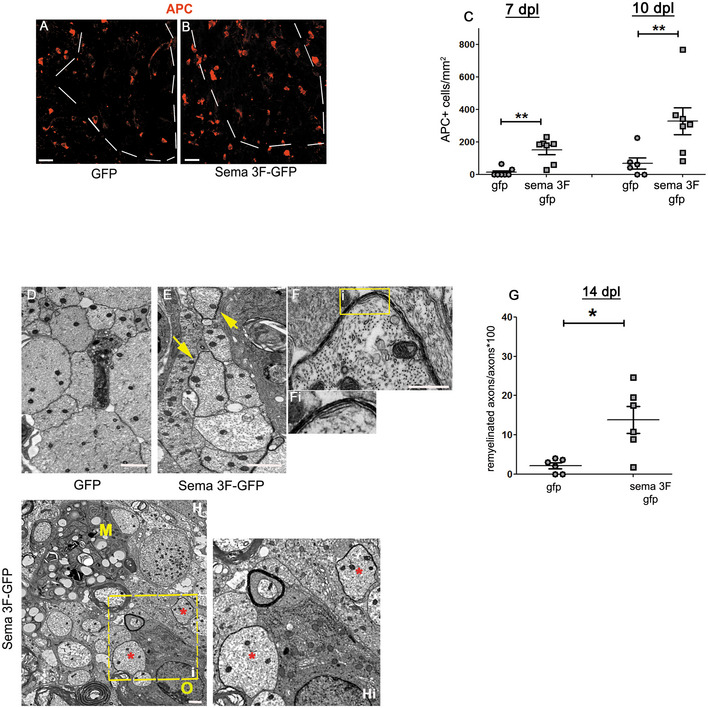
Figure 7. Oligodendrogenesis and remyelination are accelerated in Sema3F chimeras.
-
A, BLabeling for APC/CC1, a marker of oligodendrocytes. Dotted lines indicate the lesion border. APC+ cells are scarce in the lesions of GFP mice (A). B. APC+ cells in the lesion of Sema3F mice.
-
CQuantification of APC+ cells (Mann–Whitney test; P = 0.0061 for 7 dpl, P = 0.0081 for 10 dpl; n = 6–7 mice/group). *P < 0.01.
-
D, EEM images of the lesion in GFP (D) and Sema3F (E) chimeras at 14 dpl. Thin myelin sheaths in Sema3F mice (yellow arrows).
-
FHigher power image of a new myelin sheath in a Sema3F mouse. Fi. Inset of yellow square in (F).
-
GQuantification of remyelinated axons (Mann–Whitney test: P = 0.03, n = 6 mice/group). *P < 0.05.
-
HIn Sema3F mice, oligodendroglial cells (O) and early remyelination (*) are frequently observed in macrophage (M) vicinity. Hi. Inset of yellow dashed square in (H).
Data information: Scale bars 20 μm (A, B), 1 μm (D, E), and 500 nm (F).
Source data are available online for this figure.