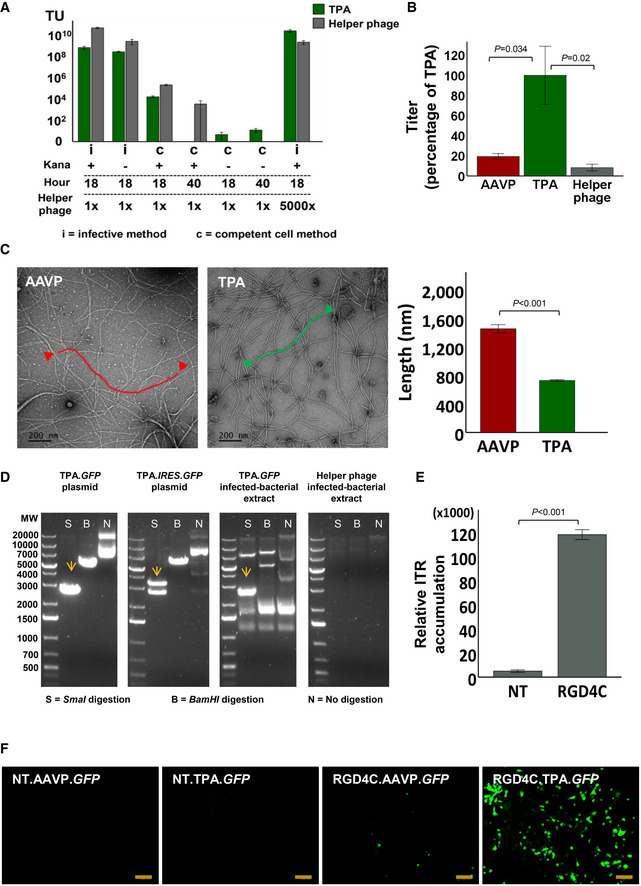
Figure 2. Optimisation of production and physical characterisation of TPA.

-
AYield comparison from standardised particle production using either superinfection by RGD4C.M13KO7 of E. coli transformed with TPA plasmid (i), or a calcium chloride competent E. coli carrying the RGD4C.M13KO7 genome (c), with or without kanamycin for selective expression, and at different incubation time endpoints. Data are expressed as mean ± SEM, and experiments were repeated three times (n = 3).
-
BPercentage yield comparison between optimised TPA and AAVP production protocols, normalised to the TPA yield. Data are expressed as mean ± SEM from three independent experiments (n = 3), one‐way ANOVA with Tukey HSD test was used.
-
CComparison of mean TPA and AAVP particle length, using a TEM. Scale bar, 200 nm. Independent t‐test was used for analysis of data shown in the graph, n = 5, technical replicates.
-
DSmaI digestion of plasmid DNA extracted from E. coli at 18 h of TPA.GFP particle production. The TPA.IRES.GFP DNA extract was used as positive control to confirm the separation of the two bands and thus complete digestion. Undigested TPA DNA was included and BamHI enzyme digestion was used to linearise the TPA plasmid. Extracts from 18 h outgrowth of bacteria carrying either TPA.GFP or helper phage were also digested.
-
EQuantification of relative intracellular TPA DNA accumulation in HEK293 cells 2‐h post‐transduction with either targeted (RGD4C) or non‐targeted (NT) TPA, 0.5 × 10⁶ TU/cell, using qPCR and annealing primers specific to the ITR sequence from AAV‐2. Data are expressed as mean ± SEM. The experiment was repeated twice in triplicate and the results shown are representative of one experiment. Independent t‐test was used for data analysis.
-
FRepresentative images of GFP‐positive HEK293 cells at day 7 post‐transduction using 1 × 10⁶ TU/cell of RGD4C.TPA.GFP or RGD4C.AAVP.GFP particles. Non‐targeted (NT) particles were included as control. Data shown are representative of five independent experiments, performed each in triplicates. Scale bar, 100 μm.
Source data are available online for this figure.
