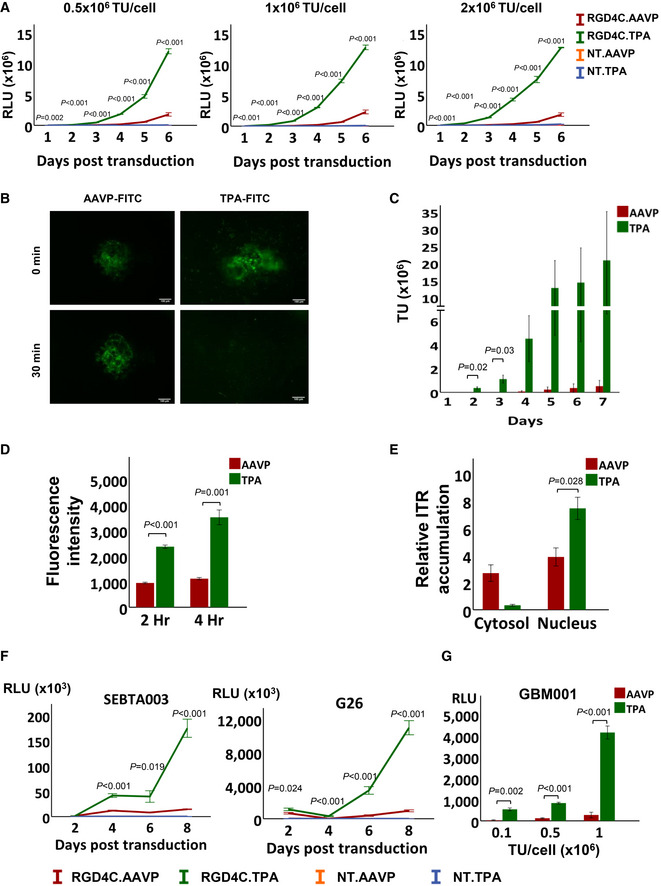
Figure 3. Characterisation of TPA‐mediated gene delivery.

-
AQuantification of gene expression in HEK293 cells after transduction with 0.5 × 10⁶, 1 × 10⁶ and 2 × 10⁶ TU/cell of RGD4C.TPA, RGD4C.AAVP or non‐targeted (NT) particles carrying Lucia. Luciferase activity was measured at days 1 to 6 post‐transduction and shown as relative light units (RLU). Data shown are representative of three independent experiments (n = 3), and are expressed as mean ± SEM. One‐way ANOVA with Tukey's HSD test was used for data analysis.
-
BRepresentative images of FITC‐labelled TPA and AAVP particle diffusion in Matrigel at 5‐ and 30‐min post‐inoculation (n = 3). Scale bar, 100 μm.
-
CParticle diffusion using a vertical trans‐well system partitioned by Matrigel. Samples were collected from the wells below the Matrigel at days 1 to 7, n = 3, technical replicates. Data are expressed as mean ± SEM, independent t‐test was used for data analysis.
-
DComparison of AAVP and TPA internalisation efficiency in HEK293 cells as evaluated by staining of the phage capsid proteins, then quantified by FACS at 2‐ and 4‐h post‐transduction, 0.1 × 10⁶ TU/cell, and normalised to particle length. Data are expressed as mean ± SEM of n = 3 independent experiments, independent t‐test was used for data analysis.
-
EQuantification of ITRs in the cytosol and nucleus of HEK293 cells 24‐h post‐transduction with 0.5 × 10⁶ TU/cell of RGD4C.TPA and RGD4C.AAVP, using qPCR with primers specific to AAV‐2 ITRs. Data are representative of n = 3 independent experiments and expressed as mean ± SEM, independent t‐test was used for data analysis.
-
FQuantification of Lucia reporter gene expression following transduction of human primary SEBTA003 glioblastoma and G26 glioblastoma‐derived neural stem cells with 1 × 10⁶ TU/cell. Data are expressed as mean ± SEM of n = 3 independent experiments. One‐way ANOVA with Tukey's HSD test was used for data analysis.
-
G3D primary GBM001 tumour spheres subjected to transduction by increasing doses of TPA and AAVP encoding Lucia. Experiments were repeated three times and performed in triplicates. Data are shown as mean ± SEM and are representative of one experiment. Independent t‐test was used for data analysis.
Source data are available online for this figure.
