
Figure EV3. Phase contract images of HEK293 cells treated with TPA.GFP and AAVP.GFP .
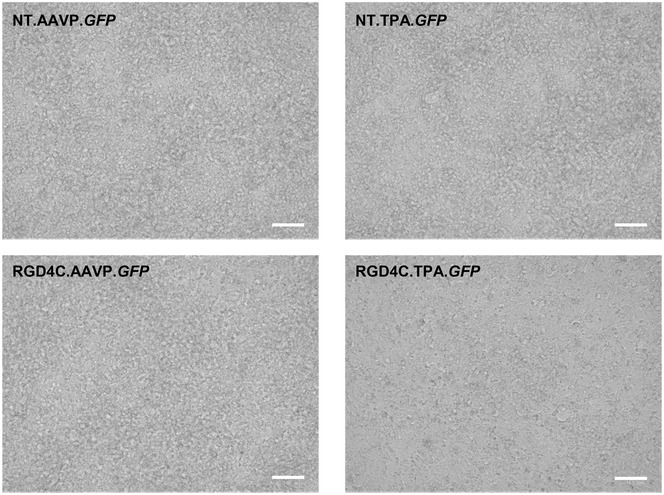
Images of cells were obtained at day 7 post‐treatment with 1 × 10⁶ TU/cell of either RGD4C.TPA.GFP or RGD4C.AAVP.GFP. Non‐targeted (NT) vectors were included as controls. Data shown are representative of three independent experiments (n = 3). Scale bar, 100 μm. Source data are available online for this figure.