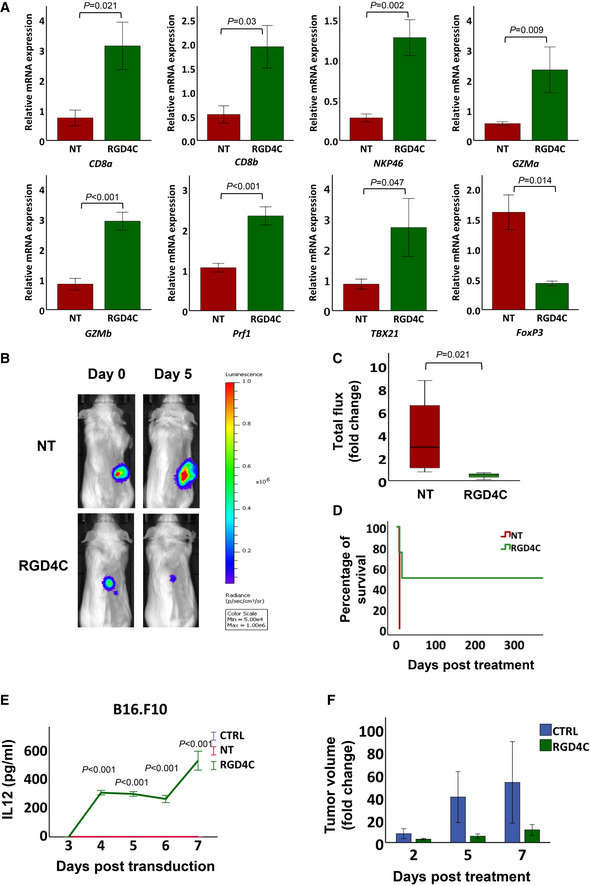
Figure 7. Tumour immune profiling after RGD4C.TPA.IL15 IgK treatment and immunotherapy with RGD4C.TPA encoding IL12 .

-
AThe immune profile of CT26.CL25 tumours was investigated using RT‐qPCR at day 5 after TPA.IL15 IgK administration. A panel of immunological mRNA transcripts were selected for analysis and included CD8a and CD8b as markers for CD8+ T cell population; NKp46 for NK cell population. Markers for cytotoxic cell‐killing by CD8+ T cells (GZMa, GZMb) and by NK cells (Prf1) were also analysed. Expression of TBX21 was evaluated as a marker for the Th1 response mediated by interferon gamma (IFN‐γ), and FoxP3 for Treg cells. Data shown are representative of n = 5 mice and expressed as mean ± SEM. Nonparametric Mann–Whitney test was used for GZMb and TBX2 data analysis, and independent t‐test to analyse data of the other markers.
-
BTPA particles encoding IL12 were used to treat immunocompetent BALB/c mice bearing subcutaneous CT26.CL25 tumours labelled with a Luc reporter gene. Representative tumour‐bearing mice at day 5 post‐treatment with targeted RGD4C.TPA.IL12 (RGD4C) or non‐targeted TPA.IL12 (NT).
-
CAnalysis of total flux change in tumours, n = 4 mice, after IL12 immunotherapy. The central band represents the median of the data. The boxes upper and lower lines represent quartile 3 and quartile 1 of the data respectively. The whiskers represent the maximum and minimum outliers of the data. Nonparametric Mann–Whitney test was used for data analysis.
-
DKaplan–Meier curves showing survival benefit for tumour‐bearing mice (n = 4) from two experimental groups.
-
ESerial quantification of IL12 in media of B16.F10 cells treated with RGD4C.TPA.IL12 or controls. Data are representative of one experiment, n = 3 biological repeats and shown as mean ± SD. Experiments were repeated three times. One‐way ANOVA with Tukey's HSD test was used for data analysis.
-
FRGD4C.TPA.IL12 immunotherapy of subcutaneous B16.F10 tumours in C57BL/6 mice (n = 4). Data are shown as mean ± SEM independent t‐test was used for data analysis. Tumour volume changes are shown over time.
Source data are available online for this figure.
