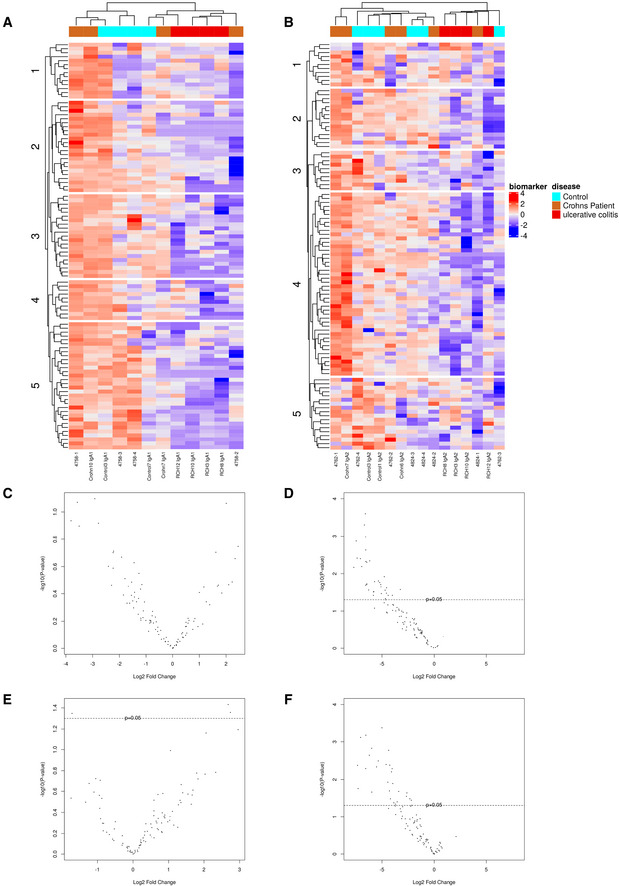
Volcano plots of log2‐transformed fold changes for IgA1 anti‐glycan reactivity in CD (C) and UC (D) groups, and IgA2 anti‐glycan reactivity for CD (E) and UC (F) compared to non‐IBD IgA1 and IgA2. For CD,
P‐values of differentially targeted glycan motifs are listed in Appendix Table
S8 and those of UC in Appendix Tables
S9 and
S10. Significance threshold was placed at
P‐value < 0.05 (indicated by the dotted line in C–F); For IgA1, Non‐IBD:
n = 4; CD:
n = 4; UC:
n = 4. For IgA2,
n = 6; CD:
n = 6; UC:
n = 6. IgA1 and IgA2 were taken matched for the same patient. All patient samples (biological replicates) have been tested in technical duplicates. A list of the glycans from each cluster is provided as Appendix Tables
S11 and
S12.

