-
A–C
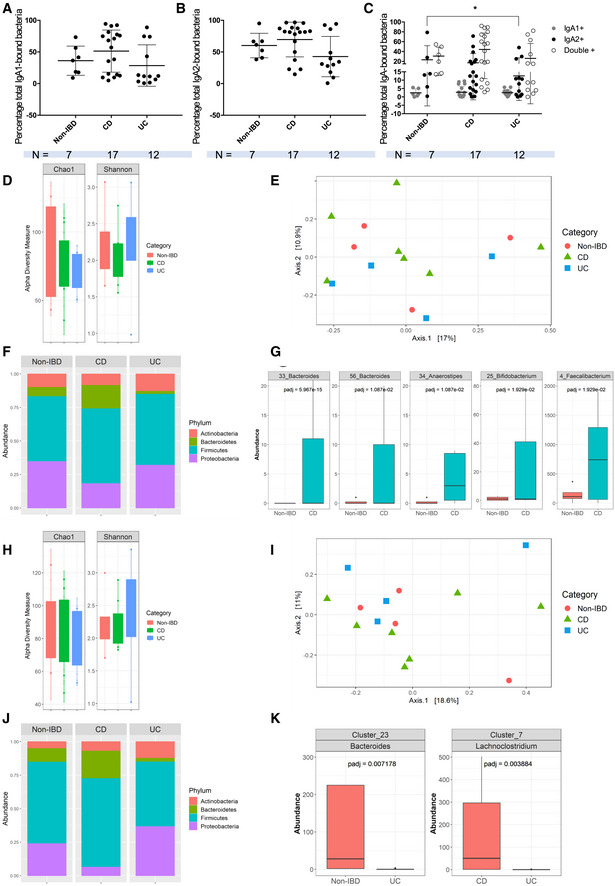
Flow cytometry analysis of total IgA1‐bound (A) and IgA2‐bound (B) fecal microbiota. (C) Flow cytometry analysis of stool IgA1+ IgA2− bacteria (gray dots), IgA1− IgA2+ bacteria (black dots) and IgA1+ IgA2+ bacteria (empty dots). (A–C) Data were analyzed with a Kruskall–Wallis multiple comparison test. In (C) *P = 0.0226. Non‐IBD: n = 7, CD: n = 18, and UC: n = 12.
-
D
Shannon and Chao1 diversity indices of IgA1‐bound microbiota in non‐IBD, CD and UC.
-
E
PCA plot based on the Jaccard distance between samples.
-
F
Phylum‐level composition of IgA1‐bound microbiota in non‐IBD, CD and UC.
-
G
Boxplots of OTUs for which the abundance was significantly different between non‐IBD and CD.
-
H
Shannon and Chao1 diversity indices of IgA2‐bound microbiota in non‐IBD, CD and UC.
-
I
PCA plot based on the Jaccard distance between samples.
-
J
Phylum‐level composition of IgA2‐bound microbiota in non‐IBD, CD and UC.
-
K
Boxplots of OTUs whose abundance was significantly different between CD and UC, and between non‐IBD and UC, respectively. OTUs present in less than 25% of samples or with read count lower than 50 were filtered out. Differential abundance was tested using negative binomial model implemented in DESeq2 and p‐values corrected with False Discovery Rate (FDR) procedure. Non‐IBD: n = 4; CD: n = 4; UC: n = 4 (two patients excluded for abundance in both IgA1 and IgA2 analyses). All patient samples have been tested in technical duplicates.

