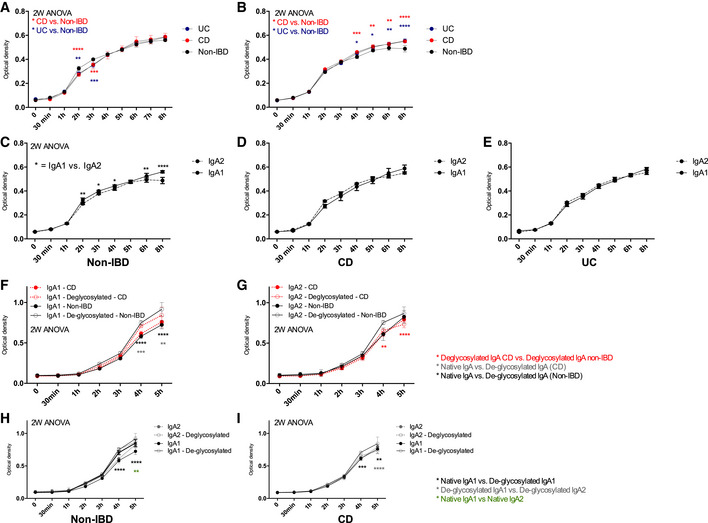
Figure 5. IBD IgA are less neutralizing than non‐IBD IgAs against pathogenic bacteria.

-
A–EOptical density (600 nm) variations during in vitro growth assay of Salmonella enterica Typhimurium (SL1344) co‐cultured with stool‐purified IgA1 (A) or IgA2 (B) from non‐IBD (n = 4), CD (n = 6) and UC (n = 3). Comparison between IgA1 and IgA2 coculture in non‐IBD (C), CD (D), and UC (E).
-
F–IOptical density (600 nm) during in vitro growth assay of Escherichia coli (25,922 strain from ATCC) cocultured with stool‐purified IgA1 (F) or IgA2 (G) from non‐IBD (n = 2) and CD (n = 2). All patient samples (biological replicates) have been tested in technical duplicates. Comparison between IgA1 and IgA2 co‐culture in non‐IBD (H), and CD (I). These IgA samples were from the same patients throughout each experiment.
Data information: Two‐way ANOVA with Holm–Sidak correction after D'Agostino–Pearson nomality test, P‐values are as follows: (A) UC curve: 2 h – P = 0.0024, 3 h – P = 0.003; CD curve: 2 and 3 h P < 0.0001 (B) UC curve: 4 h – P = 0.0186, 5 h – P = 0.0393, 6 h – P = 0.039, 8 h – P < 0.0001; CD curve: 4 h – P = 0.0001, 5 h – P = 0.0028, 6 h – P = 0.0024, 8 h – P < 0.0001. (C) 3 h – P = 0.0422, 4 h – P = 0.0422, 6 h – P = 0.0012, 8 h – P < 0.0001. (F) Gray curve: 4 h – P = 0.0004, 5 h – P = 0.0014; Black curve: 4 and 5 h – P < 0.0001. (G) De‐glycosylated CD vs. De‐glycosylated non‐IBD: 4 h – P = 0.0003, 5 h – P < 0.0001. (H) Native vs. de‐glycosylated: 4 and 5 h – P < 0.0001; De‐glycosylated IgA1 vs. De‐glycosylated IgA2: 5 h – P = 0.0012. (H) Native vs. de‐glycosylated: 4 h – P = 0.001 and 5 h – P = 0.006; De‐glycosylated IgA1 vs. De‐glycosylated IgA2: 5 h – P < 0.0001.
