
Fig. 4.
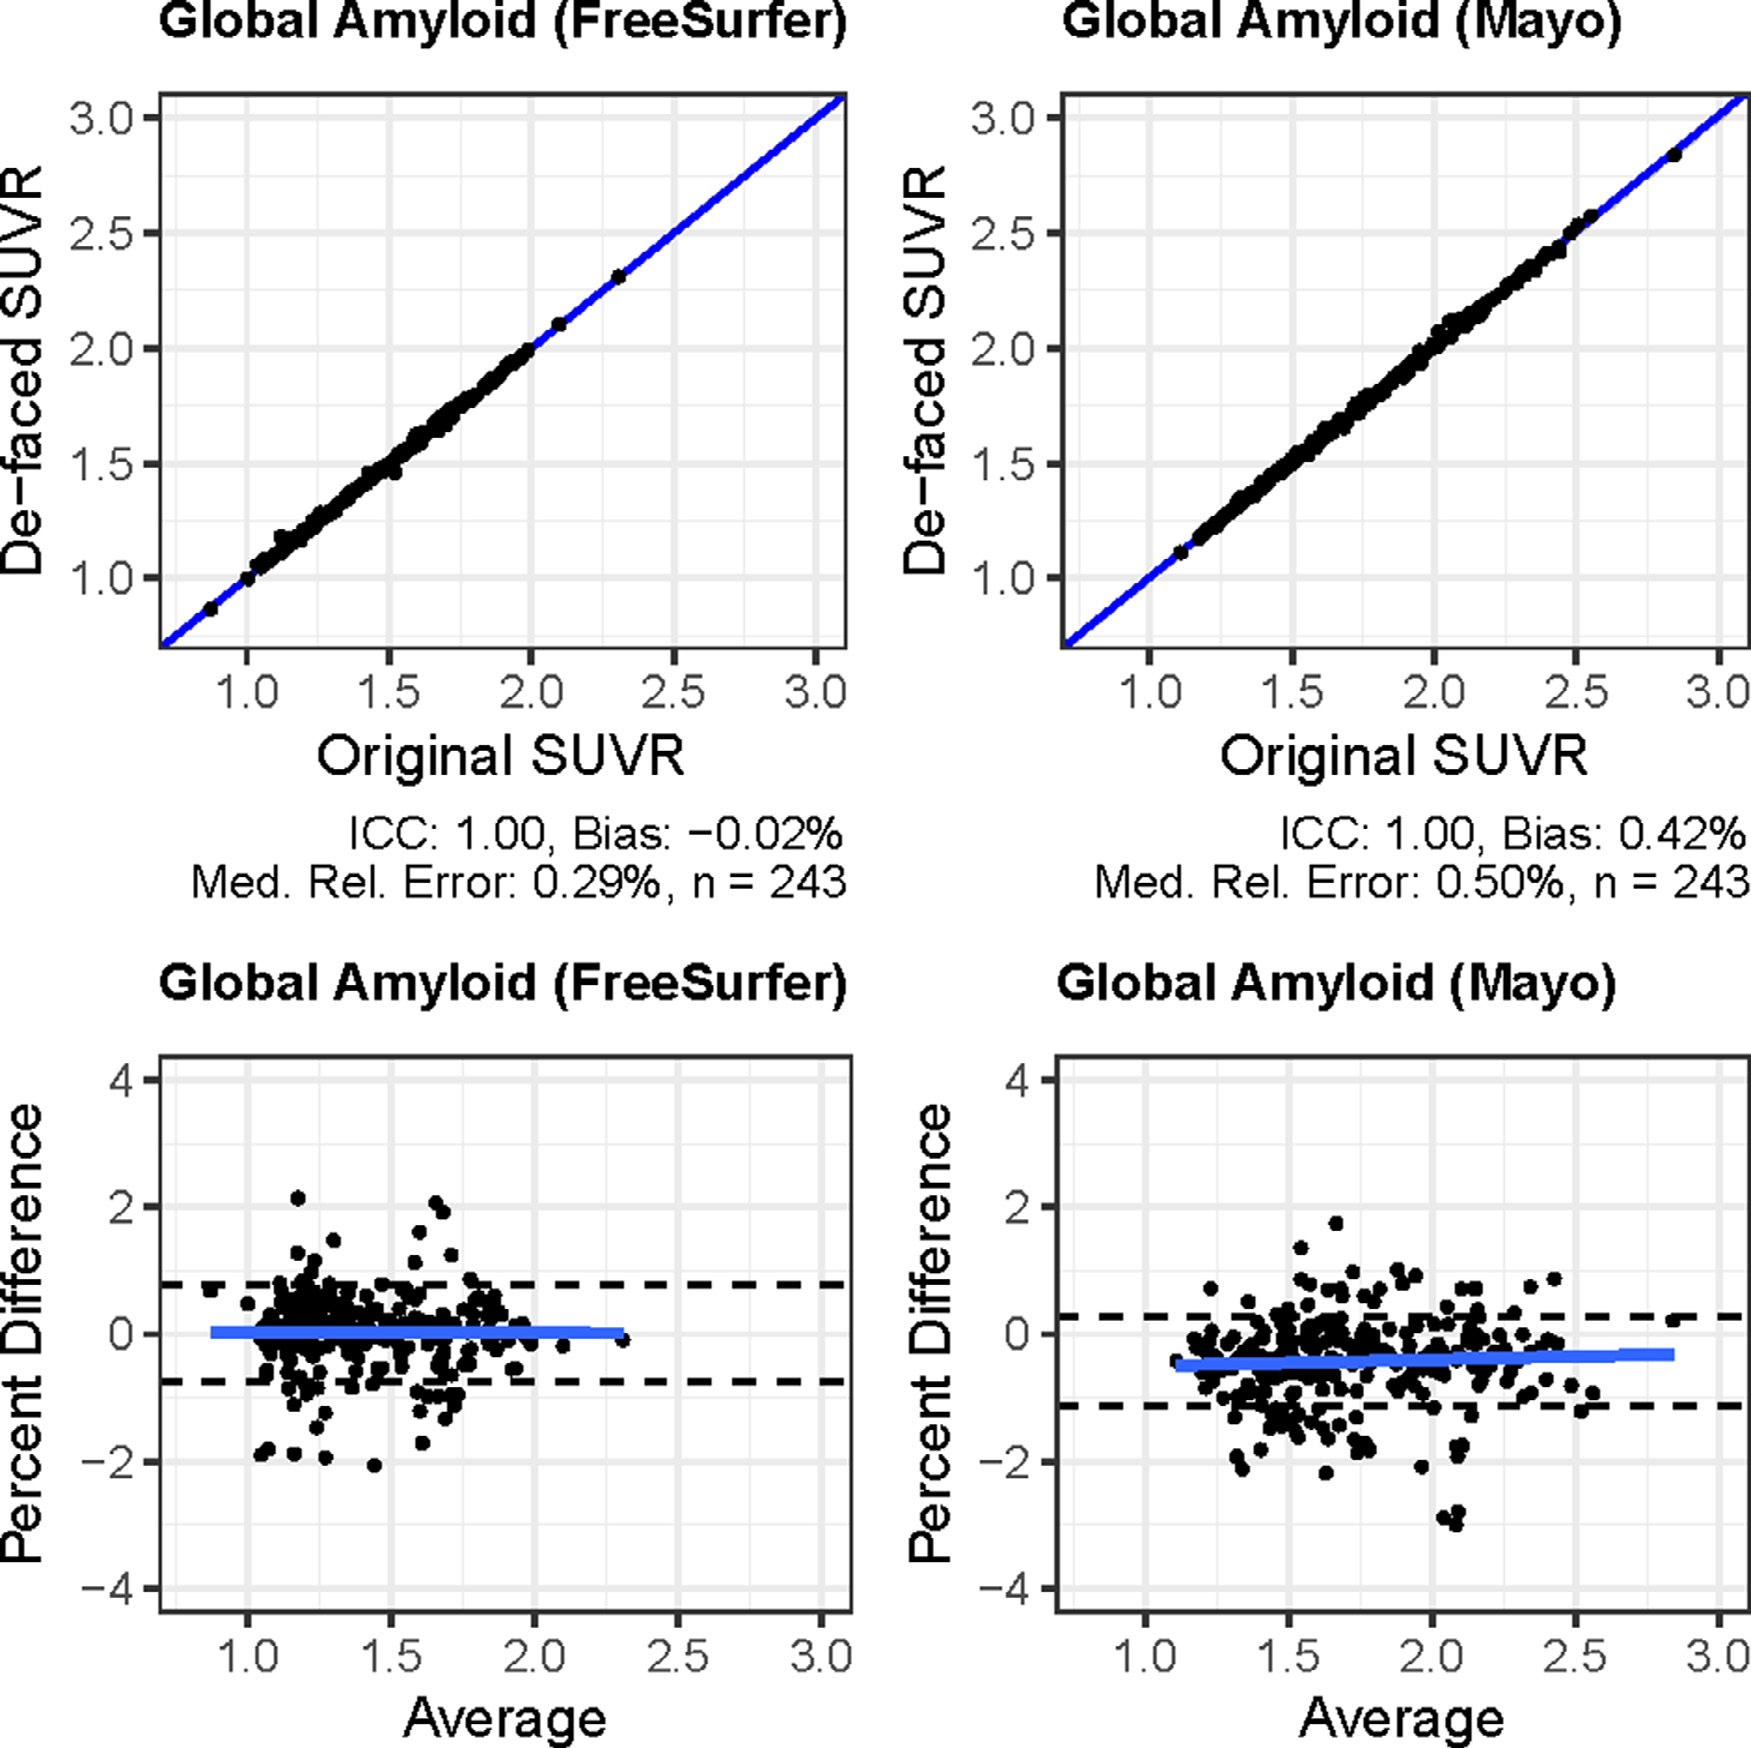
Effects of de-facing PET and MRI with mri_reface on global amyloid PET measurements from the FreeSurfer/PETSurfer pipeline (left) and the in-house pipeline (right). The top row are scatterplots, and the bottom row are Bland-Altman plots of percent differences from the same data. On the Bland-Altman plots, dashed lines show the 95% limits of agreement (mean ± (1.96 * SD)).