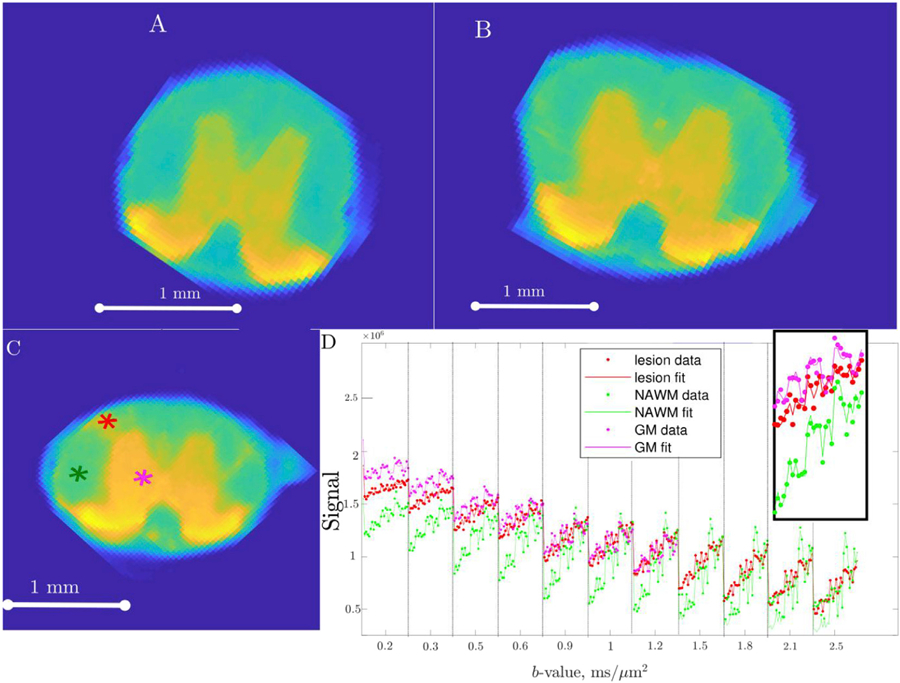
Fig. 1.

Example of acquired raw data and a corresponding data fit. Subfigures (A) and (B) show an example of a raw signal image acquired for low diffusion weighting (b=0.2 ms/µm2) in mid thoracic and low thoracic segments of a control sample. Subfigure (C) shows a high grade sample, with a visible lesion acquired with the same low diffusion weighting (b=0.2 ms/µm2). Data and data fit that correspond to three different voxels in the slice denoted in (C) are shown in subplot (D). Lesion voxel location is marked in red, NAWM voxel in green and GM voxel in magenta in subplot (C). Multiple data points plotted under each b-value on the x-axis correspond to different directions. The inset shows the enlarged part of the graph corresponding to b=0.5 ms/µm2.
