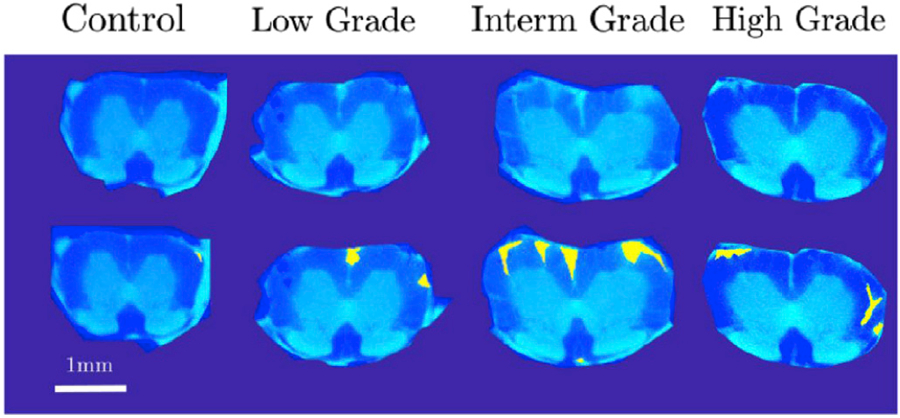
Fig. 2.

Example outcome of lesion identification in four spinal cords in a lumbar segment. From left to right the grades are control, low grade, intermediate grade and high grade of EAE. For each of two subplots, the upper image represents a raw T2*-weighted image, while the lower image shows the same map with the manual lesion delineation superimposed in yellow.
