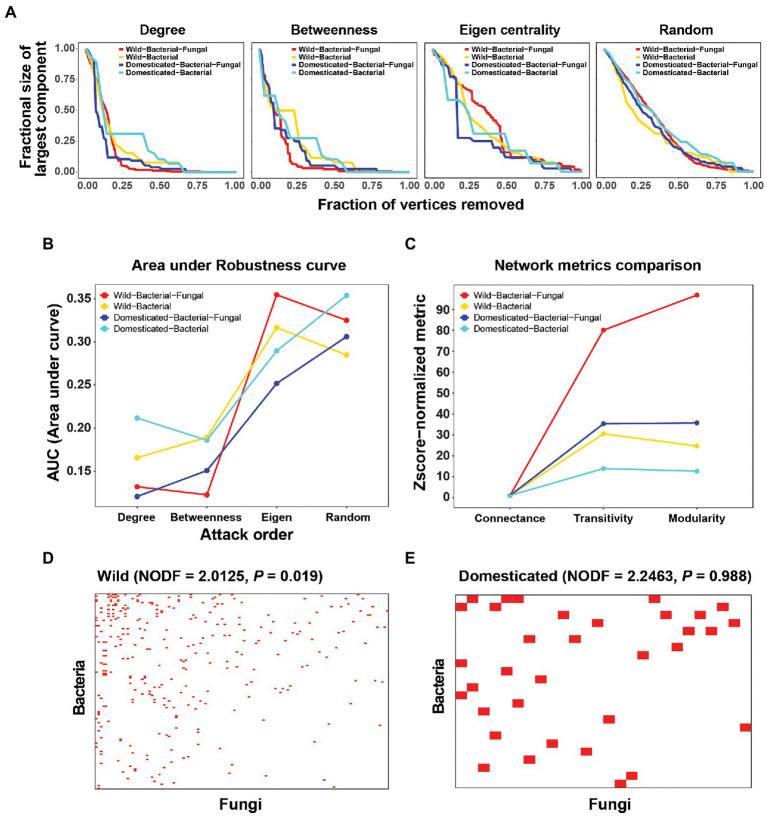
Figure 2.
Robustness analysis and connectance, transitivity, modularity, and nestedness of cross-kingdom and bacteria-only networks in wild and domesticated rice seed microbiomes. (A) Robustness analysis by in silico extinction experiments. Nodes were deleted from the network in order of degree, betweenness centrality, and eigenvector centrality, and randomly. The size of the largest component (y-axis) was recorded after every extinction event until all vertices were removed. For robustness curves, the fraction of nodes extinct and the fraction of the largest component size (largest component size after the attack ÷ largest component size before any extinction) were plotted on the x- and y-axes, respectively. (B) Area under the robustness curves for each attack order and network. (C) Z-score normalized connectance, transitivity, and modularity. Z-score normalization of summary statistics was carried out using the mean and SD of random configuration models (with the curveball method). Because the connectance of the random model had a standard deviation of 0, Z-score normalization was done by dividing by the mean of the random model. (D,E) Visualization of nestedness in wild and domesticated cross-kingdom co-occurrence networks. Rows are bacterial species and columns are fungal species. A red pixel denotes a link between bacterial and fungal species. Only edges connecting bacterial and fungal species were used to create the bipartite network.

