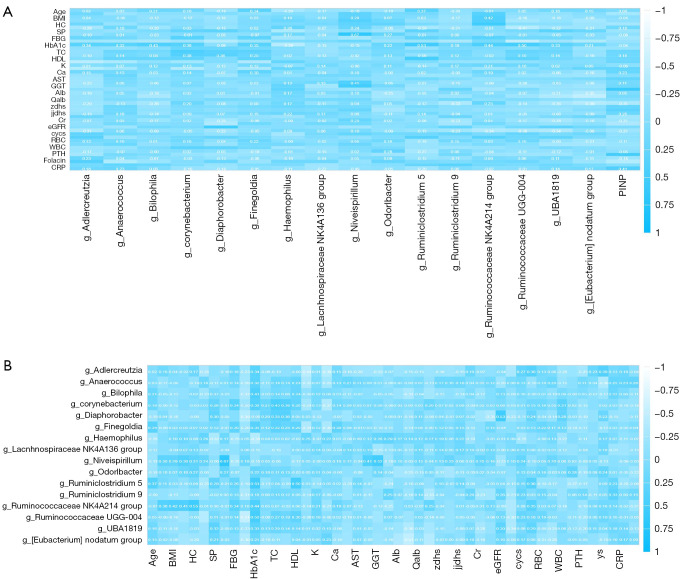
Figure 7.
Correlation analysis between clinical indicators and different microflora. (A) Correlation diagram between personal history and different strains. (B) Correlation diagram with clinical test indicators and different strains. BMI, body mass index; HC, hemoglobin concentration; SP, systolic pressure, FBG, fasting blood glucose; HbA1c, glycosylated hemoglobin, Type A1C; TC, total cholesterol; HDL, high density lipoprotein cholesterol; AST, aspartate aminotransferase; GGT, gamma-glutamyl transpeptidase; Cr, creatinine; eGFR, estimated glomerular filtration rate; RBC, red blood cell; WBC, white blood cells; PTH, parathyroid hormone; CRP, hypersensitive C-reactive protein; PINP, propeptide of Type I procollagen.

