
Figure 2.
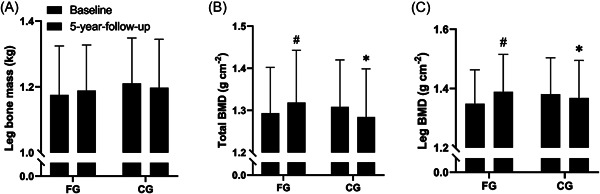
Bone health. Leg bone mass (kg) (A), total bone mineral density (BMD; g cm−2) (B) and leg bone mineral density (BMD; g cm−2) (C) at baseline and at 5‐year follow‐up for the floorball group (FG; n = 13) and control group (CG; n = 14). Data are presented as mean ± SD. # p < 0.05, compared with baseline within group. *p < 0.05, between groups.