
Figure 4.
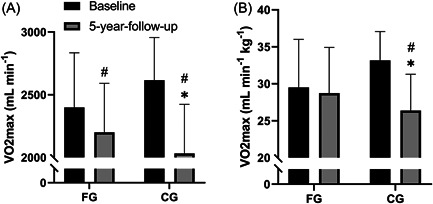
Maximal oxygen uptake. Maximal oxygen uptake (VO2max; ml min−1) (A) and maximal oxygen uptake (VO2max; ml min−1 kg−1) (B) at baseline and at 5‐year‐follow‐up for the floorball group (FG; n = 13) and control group (CG; n = 12). Data are presented as mean ± SD. # p < 0.05, compared with baseline within group. *p < 0.05, between groups.