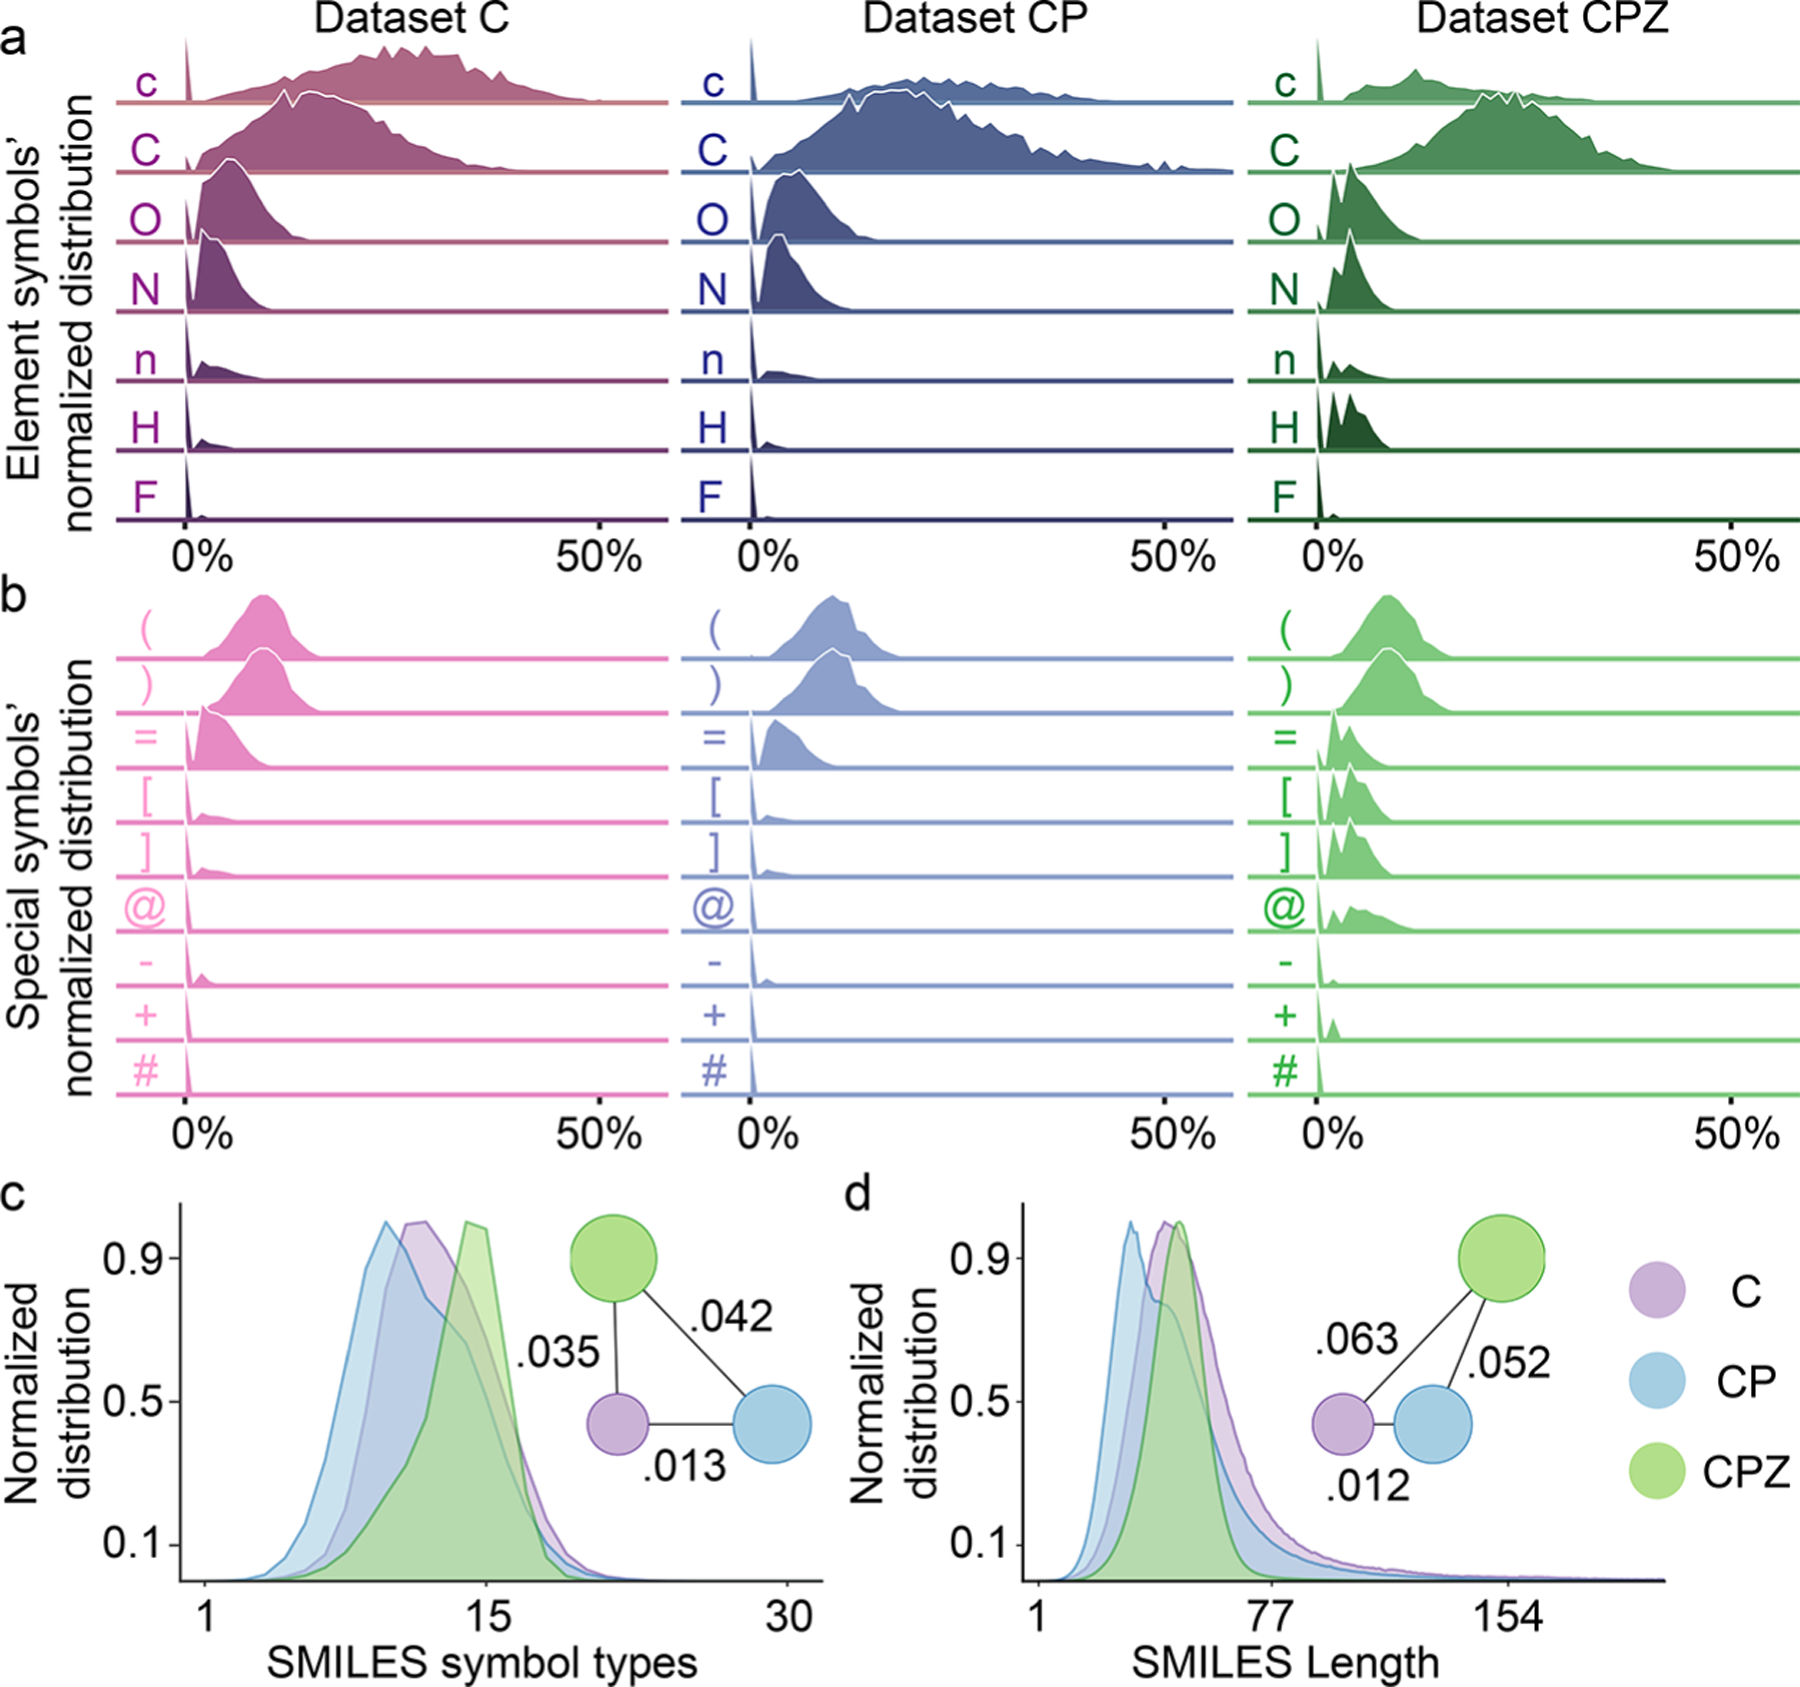
Figure 2.

Data sets analysis for the pretraining data sets. (a and b) The normalized distributions of elements and special symbols within SMILES in data set ChEMBL (C), the concatenation of ChEMBL, and PubChem (CP), and the concatenation of ChEMBL, PubChem, and ZINC (CPZ), respectively. The x-axis represents the proportion of each symbol in a SMILES string, and the y-axis represents the proportion of SMILES in the data set. (c and d) The normalized distributions of SMILES symbol types within SMILES and SMILES length in data set C, CP, and CPZ. The x-axis represents the number of different symbols per SMILES. The circles represent three data sets, and the circle size corresponds to the data set size. The correlation of each pair of data sets is determined by the Wasserstein distance.
