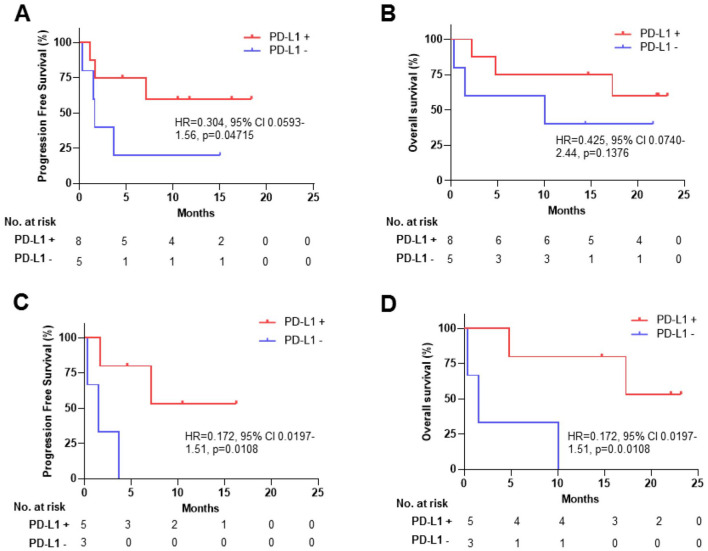
Figure 3.
Efficacy stratified by PD-L1 score. Red, PD-L1+; blue, PD-L1−. (A) PFS of all study subjects, (B) OS of all study subjects, (C) PFS of TNBC subjects, (D) OS of TNBC subjects.
CI indicates confidence interval; HR, hazard ratio; OS, overall survival; PD-L1, programmed death-ligand 1; PFS, progression-free survival; TNBC, triple-negative breast cancer.

