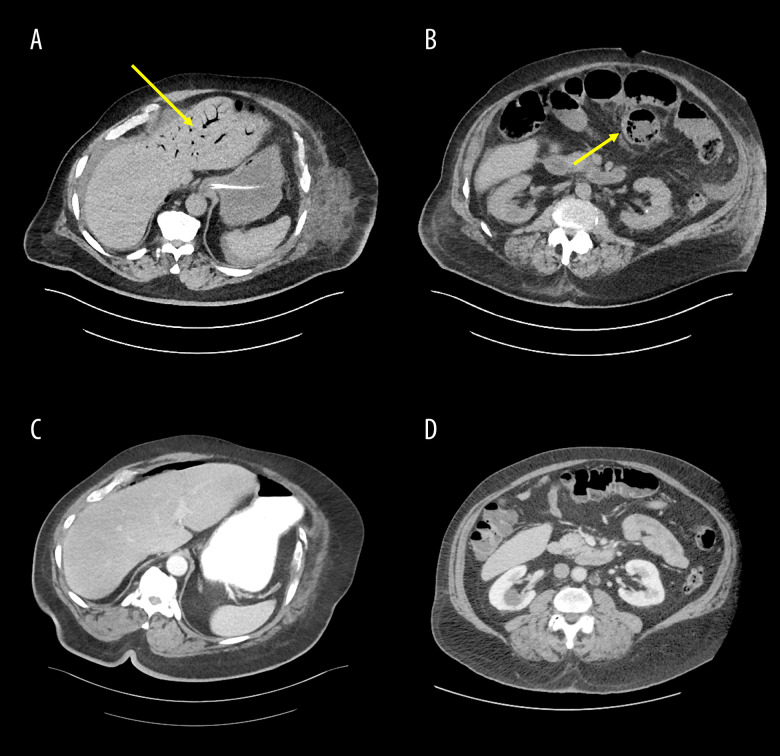
Figure 1.
CT scans of hepatic portal venous gas and pneumatosis. A and B show the hepatic portal venous gas and the pneumatosis on the tenth day of the patient’s hospital stay (postoperative day 8) in the transverse view. The yellow arrow in A shows hepatic portal venous gas, and the yellow arrow in B shows pneumatosis. C and D show the same transverse view of the patient’s abdomen as A and B, but were taken 1 day prior to his hospitalization and show no hepatic portal venous gas or pneumatosis.

