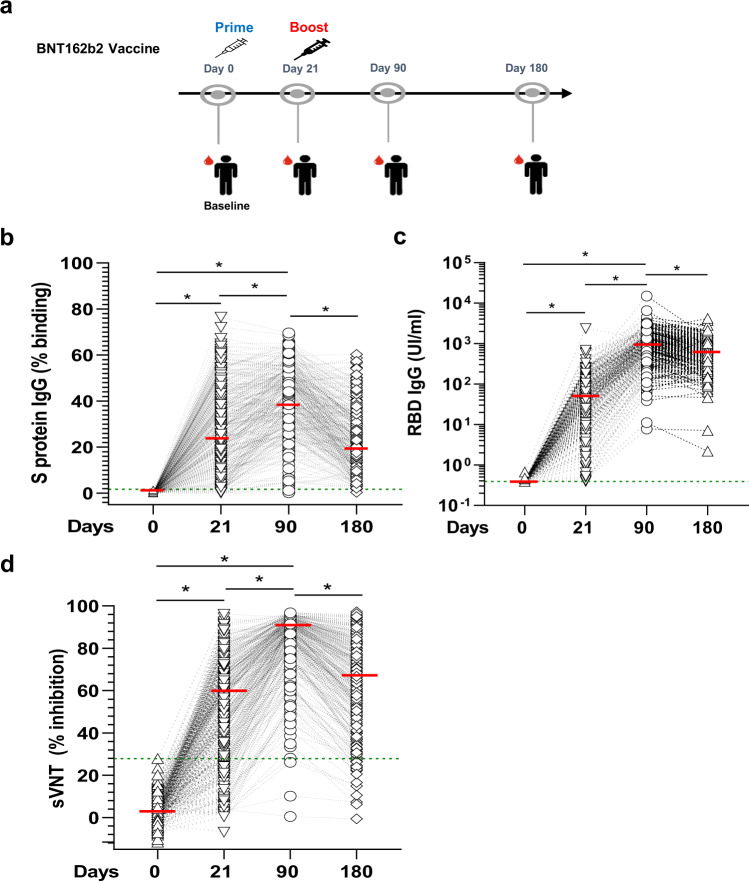
Fig. 1. Anti-SARS-CoV-2 spike protein antibody response after vaccination.
a Schematic description of the longitudinal vaccination and blood sampling strategy in a cohort of Singaporean individuals (n = 312). Kinetics of IgG response were analyzed using three serological assays on paired samples. Overall cohort baseline value is defined as the value greater than maximum range of all samples in the cohort. The green dotted line represents the maximum range of the samples in the different assays. The median values of each group are represented by a red line. b A flow cytometry-based assay using the full Spike protein (SFB) assay. Median (range) of values at day 0 was 0.06% (0.002, 1.7). Antibody levels below the maximum range (1.7%) were considered baseline values. Median values was 28.4% at day 21, 42% at day 90 and 23.35%at day 180. *p < 0.001, Friedman test. c The Roche S assay using the RBD protein fragment. Median (range) of values at day 0 was 0.39 U/ml (0.39, 0.67). Antibody levels below the maximum range (1.38 U/ml) were considered baseline values. Median values were 40.55 U/ml at day 21, 806.2 U/ml at day 90 and 603 U/ml at day 180. *p < 0.001, Friedman test. d A surrogate virus neutralization test (sVNT). Median (range) of values at day 0 was 0.39% (−11.54, 27.94). Inhibition below the maximum range (27.94%) were considered baseline values. Median values were 56.4% at day 21, 89.9% at day 90 and 67.4% at day 180 *p < 0.0001, Friedman test.

