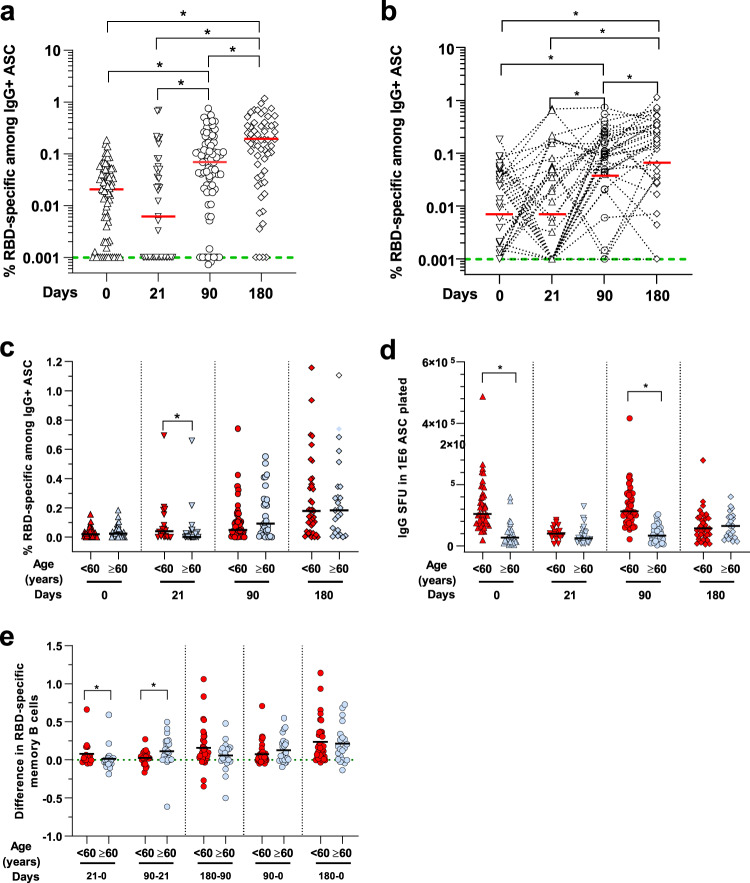
Fig. 4. Circulating RBD-specific memory B cells after vaccination.
a RBD-specific memory B cells were determined by ELISPOT using a RBD protein. Determination of % RBD-specific memory B cells among IgG+ antibody-secreting cells (ASC) done on PBMC from vaccinated participants at baseline or day 0 (n = 73), at day 21 (n = 43), at day 90 (n = 76) and at day 180 (n = 60). The median value of each group is represented by a red line and were at day 0, 21, 90 and 180, respectively 0,02%, 0.006%, 0.07% and 0.18% of the % RBD-specific memory B cells among IgG+ ASC. *p < 0.01, Dunn’s test after Kruskal–Wallis (p < 0.001) on log-transformed data. Green dotted lines indicate the limit of detection for the assay. b Paired wise comparison of % RBD-specific memory B cells among IgG+ ASC for the analyzed aged group at different days post doses is shown (n = 35). The median value of each group is represented by a red line and is the same as in (a). *p < 0.01, Friedman test on log transformed data. c RBD-specific memory B cells comparison between the analyzed age groups. Samples were from individuals: aged <60: at day 0 (n = 46), day 21 (n = 18), day 90 (n = 46), and day 180 (n = 37); and aged ≥60, at day 0 (n = 27), at day 21 (n = 25), at day 90 (n = 30), and day 180 (n = 23). d Total IgG producing memory B cells comparison between the same analyzed age groups as above in (c). The median value of each group is represented by a black line. *p < 0.01, two-sided Mann–Whitney test. e Difference in RBD-specific memory B cells between paired samples and different time points (n = 35). *p < 0.01, two-sided Mann–Whitney test.

