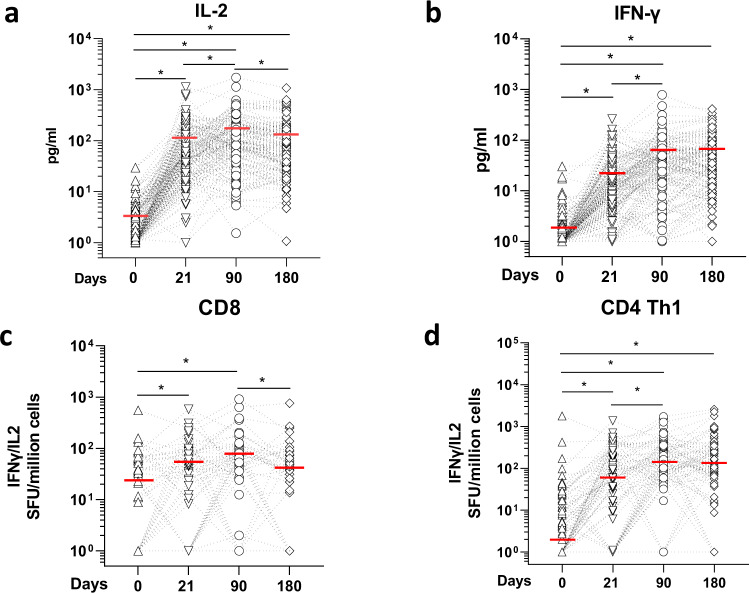
Fig. 5. Anti-SARS-CoV-2 spike protein T cell responses.
a IL-2 and b IFN-γ secretion profile of whole-blood cultures stimulated with S protein peptide pool compared at different time points of paired samples from vaccinated individuals (n = 160). The limit of detection for each cytokine (IL‐2 = 5.4 pg/ml; IFN‐γ = 1.7 pg/ml). Values below limit of detection levels were plotted as 1. *p < .001, ANOVA on log-transformed data, which follow a normal distribution. The mean values of each group are represented by a red line and were at day 0, 21, 90 and 180: 1.8 pg/ml, 23.8 pg/ml, 55.4 pg/m and 57.2 pg/ml for IL-2; 2.96 pg/ml, 102.6 pg/ml, 154.2 pg/ml and 123.9 pg/ml for IFN‐γ, respectively. Kinetics of Spike-protein-specific CD8 c or d CD4 Th1 cells overtime in vaccinees. T cells were assayed on a subset of vaccinees (n = 80) by IL-2/ IFN-γ ELISPOT using 9 mer or 15 mer pool peptides, respectively. Data are presented are spot forming units (SFU) per million of PBMC from paired samples from vaccinated individuals at four time points. Each data point represents the normalized mean spot count from duplicate wells for one study participant, after subtraction of the medium-only control. The median values of each group are represented by a red line and were at day 0, 21, 90 and 180: 26.4, 46.2, 55.4 and 57.2 SFU for CD8 T cells; and 2, 67.25, 167.4 and 134.5 SFU for CD4 Th1 cells *p < 0.01, Dunn’s test after Kruskal–Wallis (p < 0.001) on log-transformed data.

