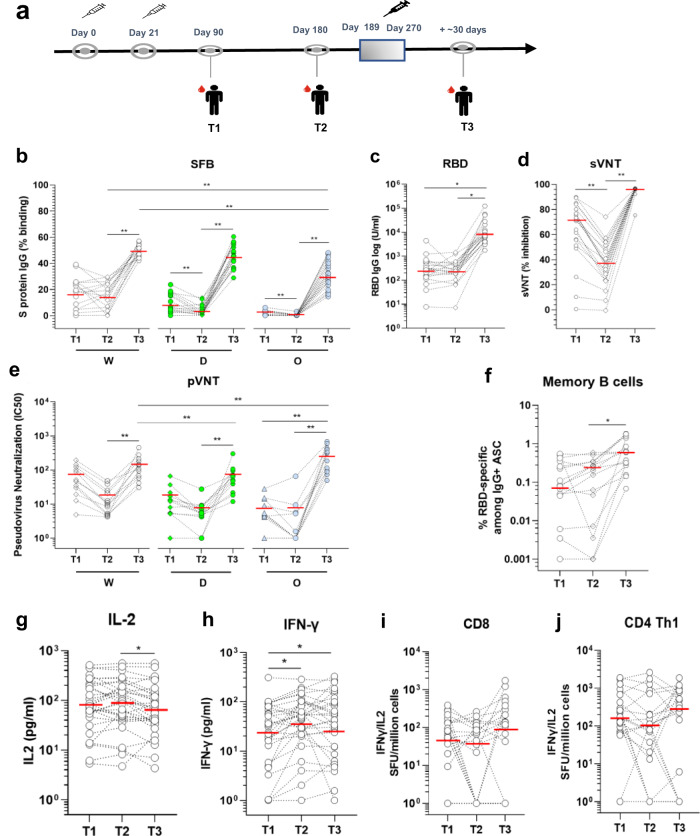
Fig. 7. Anti-SARS-CoV-2 spike protein antibody and T cell response before and after the third booster dose.
a Blood sampling strategy in subsets of the cohort of Singaporean individuals mentioned in Fig. 1. Kinetics of IgG response were analyzed using three serological assays on paired samples taken at time T1 (day 90), T2 (day 180), and T3 (day 189–270) post first injection. b SFB assay using the cells expressing the Wuhan ancestral strain (W, white dots), Delta (D, green dots) or Omicron variant (O, blue dots). Median of group values at T1 (n = 16), T2 (n = 20), and T3 (n = 20) were: 19, 16.45, and 50.2% (W); 6.7, 2.56, and 45,73% (D); and 1, 0.18, and 31.65% (O). p < 0.001, Friedman test; c Anti-RBD antibodies using the Roche S assay. Median of values (n = 20) at T1, T2, and T3 were 277, 246.8 and 7723 U/ml; *p < 0.001, Friedman test. d Surrogate virus neutralization test (sVNT). Median values (n = 20) at T1, T2, and T3 were 71.2, 36,94 and 96.4% of inhibition. *p < 0.0001, Friedman test. e Neutralization assay using pseudoviruses expressing the SARS-CoV-2 Spike of the Wuhan ancestral strain (W), Delta variant (D) or the Omicron variant (O) (n = 12). Median of IC50 values at T1, T2, and T3 are 48.9, 10.2, and 123.2 (W); 12.5, 5.3, and 57.1 (Delta); 5.0, 1.0, and 248.9 (Omicron) respectively. *p < 0.01, Friedman test. f RBD-specific memory B cells. Paired wise comparison of total RBD-specific memory B cells for the analyzed aged group at different days is shown (n = 15). Median of values at T1, T2, and T3 are 0.08%, 0.2 and 0.6 % of total PBMC. **p < 0.001, Friedman test. g IL-2 and h IFN-γ secretion profile of whole-blood cultures stimulated with S protein peptide pool compared at the three time points of paired samples from vaccinated individuals (n = 31). The limit of detection for each cytokine (IL‐2 = 5.4 pg/ml; IFN‐γ = 1.7 pg/ml). Values below limit of detection levels are plotted as 1. Median of values at T1, T2, and T3 are: 81.2, 96.6 and 62.8 pg/ml for IL-2, and 31.2, 52 and 43 pg/ml for IFN-γ and are indicated as red lines. *p < 0.01, two-way ANOVA on log-transformed data, which follow a normal distribution. Kinetics of Spike-protein-specific CD8 (i) or CD4 Th1 cells (j) over time in vaccinees. T cells were assayed on a subset of vaccinees (n = 11) by IL-2/ IFN-γ ELISPOT as in Fig. 5. Data are presented are spot forming units (SFU) per million of PBMC from paired samples from vaccinated individuals at three time points. Each data point represents the normalized mean spot count from duplicate wells for one study participant, after subtraction of the medium-only control. Values below limit of detection levels are plotted as 1. Median of values at T1, T2, and T3 are: 79, 45.3 and 118.9 SFU for CD8 T cells, and 173, 105.1 and 295.9 SFU for CD4 Th1 cells and are indicated as red lines. *p < 0.01, Dunn’s test after Kruskal–Wallis test.

