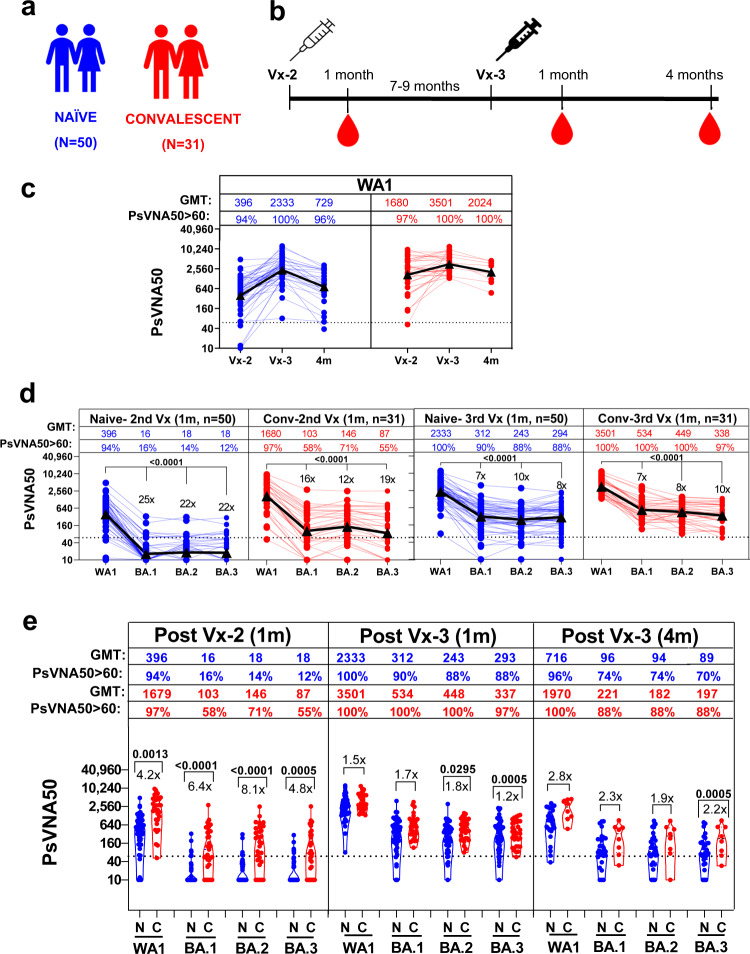
Fig. 1. Neutralizing antibodies following second and third vaccination in naïve and convalescent adults against SARS-CoV-2 WA-1 and Omicron subvariants.
a Overview of vaccination cohort, including 50 unexposed naive (N; in blue) and 31 COVID-19 convalescent (C; in red) adults receiving second and third mRNA vaccination. b Timeline of SARS-CoV-2 vaccination and sample collection in the two adult cohorts. c–e SARS-CoV-2 neutralizing antibody titers in naive (N; in blue) vaccination and convalescent adults (C; in red) one month after the second or third mRNA vaccination and four months post-3rd vaccination against SARS-CoV-2 WA1 and Omicron BA.1, BA.2 and BA.3. c PsVNA50 of post-2nd (Vx-2) or at 1 m and 4 m post-third dose (Vx-3) against WA1. Geometric mean PsVNA50 titers (GMT) are shown as black triangles and are presented for each vaccination time-point on top of the panel. Each data point represents an individual sample (circles). The horizontal dashed line indicates the seropositive cut-off for the neutralization titers (PsVNA50 of 60). Percent seropositivity (%S) for each group was calculated as number of seropositive samples divided by total number of samples x 100 in the group. The limit of detection for the neutralization assay is 1:20. Any sample that does not neutralize SARS-CoV-2 at 20-fold dilution was given a value of 10 for representation and data analysis purposes. d Plots showing PsVNA50 titers at 1 m after second or third mRNA vaccination serum of naïve (N; in blue) and convalescent (C; in red) adults against WA1 and Omicron BA.1, BA.2 and BA.3. The fold-reduction in titers to Omicron BA.1 or BA.2 or BA.3 compared with WA1 are shown. e Comparisons of PsVNA50 titers against WA1 and Omicron BA.1, BA.2 and BA.3 for 1 m post-second or post-third mRNA vaccination or 4 m post-3rd vaccination from 50 naïve (N; in blue) vs. 31 convalescent (C; in red) adults. Percent seropositivity is color coded for each of the group. The fold-difference in titers between naïve vs convalescent cohorts are shown. Differences between naïve vs. convalescent cohorts were analyzed using Tukey’s pairwise multiple comparison test that controlled for age, sex and BMI as covariates and the two-sided statistically significant p-values are shown. Nonsignificant p values (p > 0.05) are not shown. The data shown are average values of two experimental runs.

