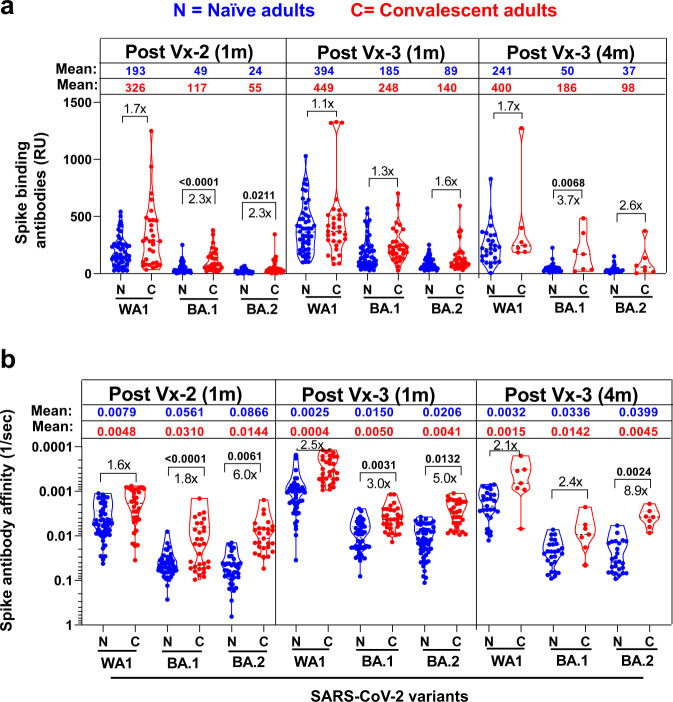
Fig. 2. Antibody affinity maturation of human antibody response to SARS-CoV-2 spike of WA1 and Omicron subvariants BA.1 or BA.2 following second and third SARS-CoV-2 mRNA vaccination in naïve vs. convalescent adults.
a Mean values ± range of total antibody binding (determined by maximum resonance units, Max RU) of 1:10 diluted serum samples of 50 unexposed naïve (N; in blue) adults vs. 31 COVID-19 convalescent (C; in red) adults at 1 m after second (Vx-2) or third mRNA vaccination (Vx-3) or 4 m post-3rd vaccination to purified trimeric spike of WA1 or Omicron subvariants BA.1 or BA.2 by SPR. The mean values for Max RU for each spike are color coded by each group. b Polyclonal antibody affinity maturation (as measured by dissociation off-rate per sec) to SARS-CoV-2 spike proteins for 1 m after second (Vx-2) or third mRNA vaccination (Vx-3) or 4 m post-3rd vaccination for serum samples from 50 unexposed naïve (N; in blue) and 31 COVID-19 convalescent (C; in red), adults were determined by SPR. Antibody off-rate constants that describe the fraction of antibody-antigen complexes decaying per second were determined directly from the serially diluted post-vaccination sample interaction with SARS-CoV-2 spike proteins using SPR in the dissociation phase as described in Materials and Methods. Off-rate was calculated and shown only for the sample time points that demonstrated a measurable (>10RU) antibody binding in SPR. Antibody affinity was not determined for those serum whose spike-binding antibodies were <10RU. The mean values are color coded by each group. The fold-difference in antibodies between naïve vs convalescent cohorts are shown. All SPR experiments were performed twice and the researchers performing the assay were blinded to sample identity. The variation for each sample in duplicate SPR runs was <6%. The data shown are the average value of two experimental runs. Differences between naïve vs. convalescent cohorts were analyzed by lme4 and emmeans packages in R using Tukey’s pairwise multiple comparison test that controlled for age, sex and BMI as covariates and the two-sided statistically significant p-values are shown. Nonsignificant p values (p > 0.05) are not shown.

