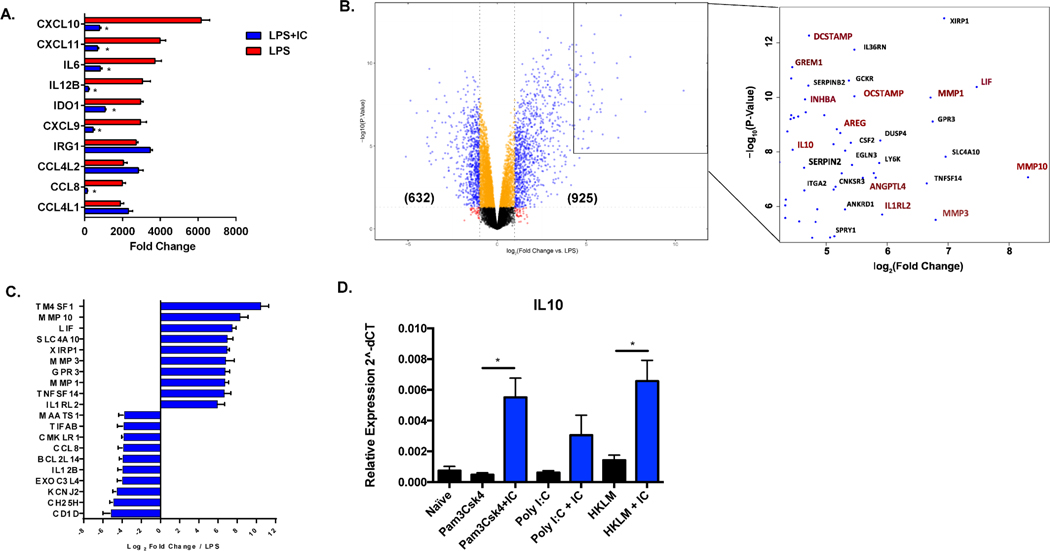
Figure 1. Global changes in gene expression following the stimulation of human macrophages in the presence of immune complexes.
Human monocyte derived macrophages were stimulated with LPS (30 ng/mL) or LPS plus immune complexes (ovalbumin/anti-ovalbumin) for 4 hours, and total mRNA was isolated and sequenced on the Illumina platform (n=3). (A) The 10 most highly upregulated genes in LPS-stimulated macrophages are designated by red bars and expressed as fold change relative to resting macrophages (mean ± SEM). Values for corresponding fold-changes in LPS+IC stimulated macrophages are designated by blue bars. Asterisks designate significant differences (adjusted P-value ≤0.05) between LPS vs LPS+IC. (B) Volcano plot of genes expressed in LPS+IC relative to LPS alone. In parentheses are the number of genes upregulated or downregulated by greater than 2-fold, with adjusted P-value ≤0.05. The box shows some of the most highly upregulated genes by fold-change and significance. Genes marked in red are associated with cell growth, angiogenesis, and extracellular matrix remodeling. (C) The top 10 most highly upregulated and downregulated genes in macrophages stimulated with LPS+IC relative to stimulation with LPS alone, expressed by log2 fold change (mean ± SEM). (D) RT-PCR of IL-10 transcripts following stimulation with TLR agonists, Pam3Csk4, Poly I:C, or HKLM in the absence (black bars) or presence (blue bars) of particulate immune complexes (IC) composed of latex beads coated with rabbit polyclonal IgG. Y axis represents expression (2˄dCT) relative to Actin/Rab7 (mean ± SEM, n=3).

