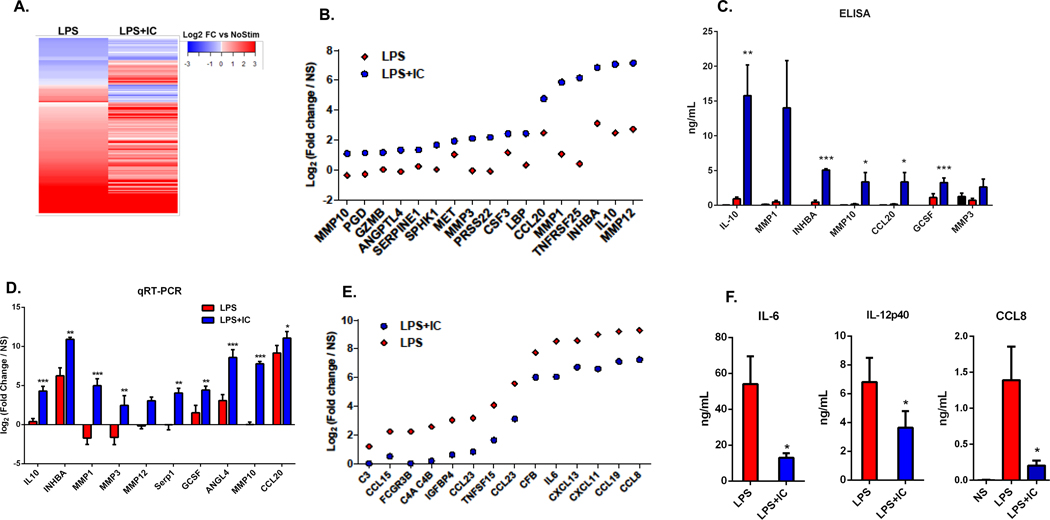
Figure 2. The macrophage secretome.
Cell culture supernatants, collected from human monocyte-derived macrophages at 24 hours following stimulation with LPS or LPS+IC were compared to that of unstimulated macrophages. (A) Differential protein expression, as measured by SOMAScan technology, in the supernatants of LPS or LPS+IC stimulated macrophages relative to unstimulated macrophages are represented by a heatmap. (B) The top 17 up-regulated proteins in LPS+IC relative to LPS alone, and their fold-change in LPS+IC (blue) or LPS-stimulated macrophages (red). (C) Supernatants were analyzed by ELISA to measure the accumulation of 7 proteins that were identified in the SOMAScan analysis following no stimulation (black) or stimulation with LPS+IC (blue) or LPS alone (red) (mean ± SEM, n=5) (D) RT-PCR was used to measure transcript levels of 10 of the genes that were identified in the SOMAScan analysis (4 hours post-stimualtion). Bars represent log2 fold change (mean ± SEM, n=6 versus non-stimulated macrophages. (E) The top 14 downregulated proteins from the SOMAScan analysis when comparing LPS+IC to LPS stimulation are shown. Dots represent LPS+IC (blue) or LPS alone (red) log2 fold-changes relative to unstimulated macrophages. (F) Supernatants of stimulated macrophages were analyzed by ELISA to measure the downregulation of IL-6, IL-12(p40), and CCL8 following stimulation with LPS+IC (blue) or LPS (red) (mean ± SEM, n=3). Statistical significance indicated in panels C, D, and F was calculated using a paired t-test. Asterisks designate significant differences (*P-value ≤0.05, ** P-value ≤0.01, *** P-value ≤0.001 ) between LPS vs LPS+IC.

