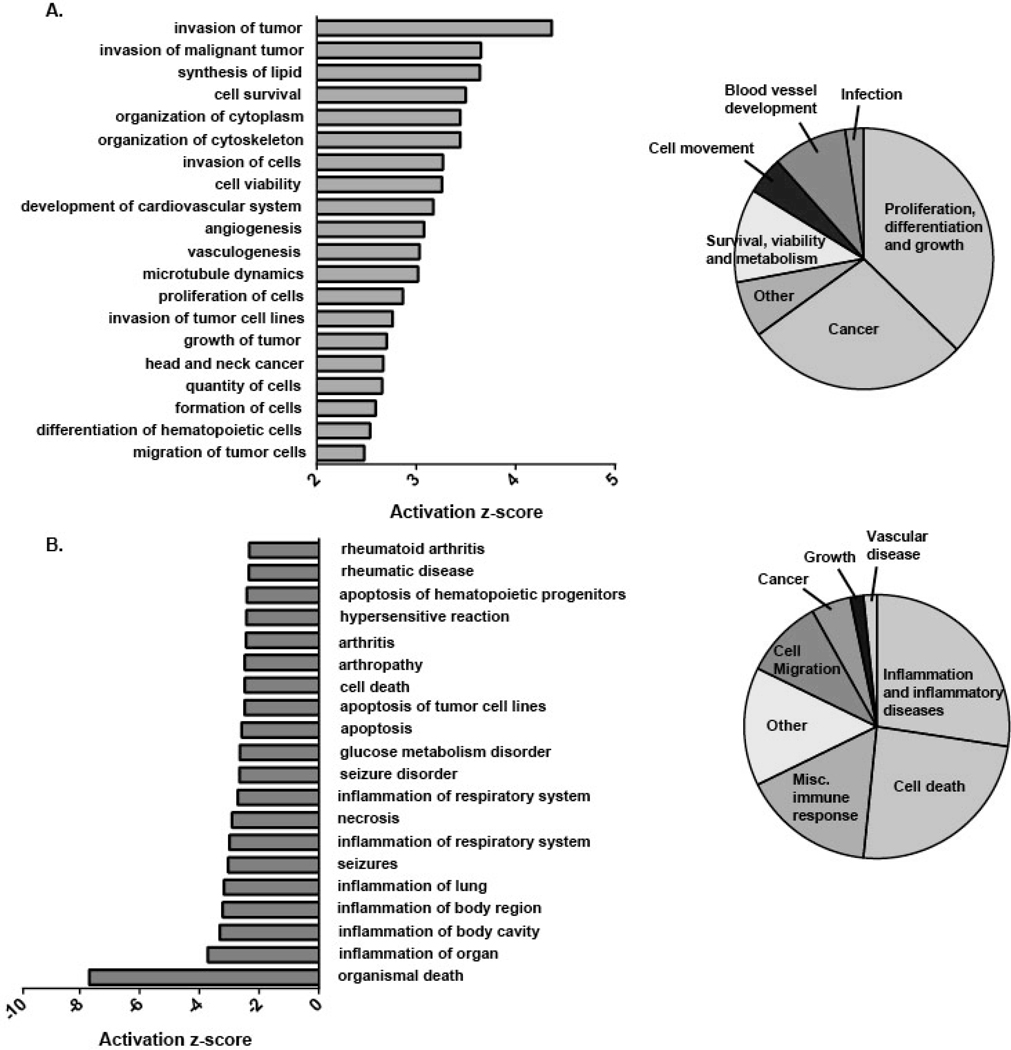
Figure 3. Functional properties of macrophages stimulated in the presence of immune complexes.
Differentially expressed genes (DEGs) in macrophages (FC ≥2 or ≤ −2) stimulated with LPS+IC were compared to cells stimulated with LPS alone, and uploaded into the Ingenuity Pathway Analysis Program and the Diseases and Functions Report was generated (n=3). Bar graphs (left) represent the top 20 (A) positively and (B) negatively enriched pathways ranked by z-score. Enriched diseases and functions were manually categorized into broader groups (pie charts) in a non-overlapping manner.

