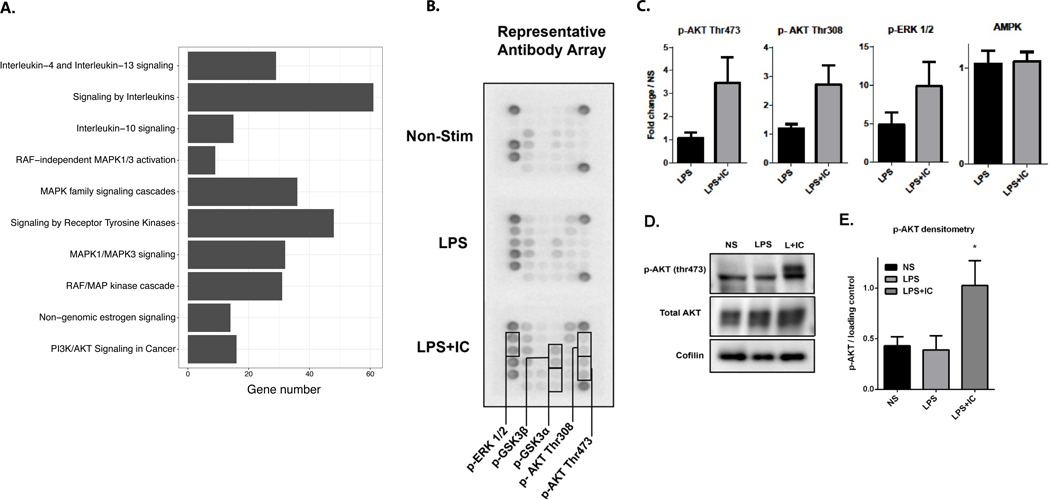
Figure 4. Signaling in R-Mϕ-IC.
(A) A bar graph of 10 enriched (ordered by adjusted P-value < 0.02) Reactome pathways among genes upregulated in macrophages stimulated with LPS+IC vs. LPS (n=3). The size of the bar along the X-axis indicates the number of differentially upregulated genes found in each pathway. (B) Representative image of antibody array (Cell Signaling Technologies) from whole cell lysates of non-stimulated human macrophages or those stimulated for 20 minutes with LPS alone or LPS+IC. (C) Densitometry was calculated using Image J software. Values are mean fold change compared to non-stimulated (NS) macrophages and error bars are SEM (n=3). (D) A representative western blot of macrophage lysates confirms antibody array results for p-AKT thr473 and total AKT. (E) Densitometry of three independent western blots to quantify AKT phosphorylation following stimulation with LPS or LPS+IC relative to non-stimulated cells (mean ± SEM, n=3). Statistical significance was calculated using a paired t-test; *P-value ≤0.05.

