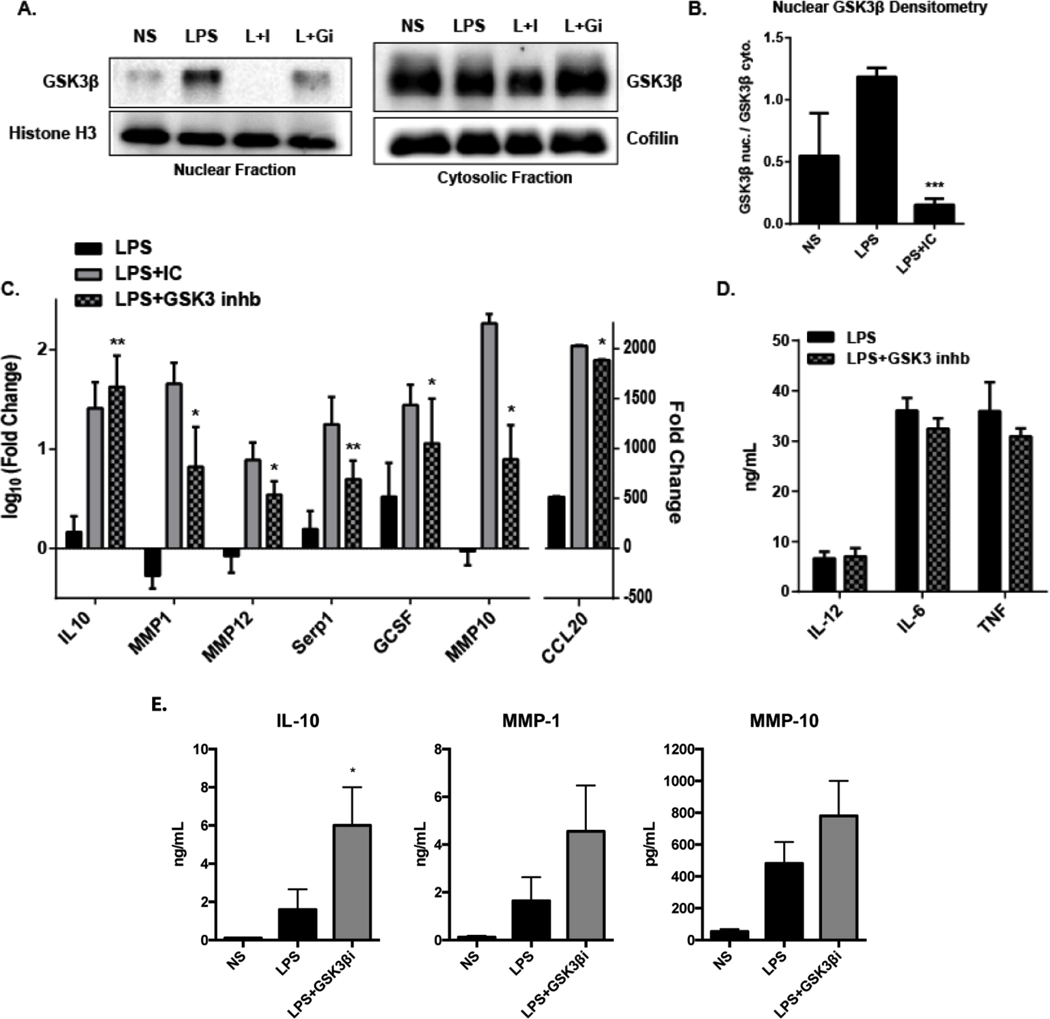
Figure 5. GSK3β inhibition in R-Mϕ-IC.
5.(A) Western blotting for GSK3β in the nuclear (left) or cytosolic (right) fractions of macrophage lysates collected 30 minutes after stimulation with LPS alone, LPS and immune complexes (L+I) or LPS in combination with SB415286 (20 μM), an inhibitor of GSK3 (L+GI). (B) Densitometry was calculated using Image J software. Bars represent mean fold change ± SEM in the nucleus over cytosolic levels (n=3). (C) RT-PCR results for macrophages stimulated with LPS (black), LPS+IC (grey) or LPS in the presence of 20 μM SB415286 to inhibit GSK3 (stippled). RNA was collected 7 hours after stimulation, expressed as fold change (log10) ± SEM relative to non-stimulated macrophages (n=4, * P-value ≤0.05; ** P-value ≤0.01). (D) The production of inflammatory cytokines, IL12(p40), IL-6, and TNF was measured by ELISA, 7 hours after stimulation with LPS alone (black) or LPS + SB415286 (grey) to inhibit GSK3 (mean ± SEM n=3). (E) Macrophages were stimulated with LPS alone (black bars) or LPS with AZD2858 (750 nM), a small-molecule inhibitor specific for GSK3β (Grey bars). The levels of IL-10, MMP1, and MMP10 in supernatants was measured by ELISA 16 hours later Statistical significance for panels B through E was calculated using a paired t-test. (mean ± SEM, n=3, * P-value ≤0.05).

