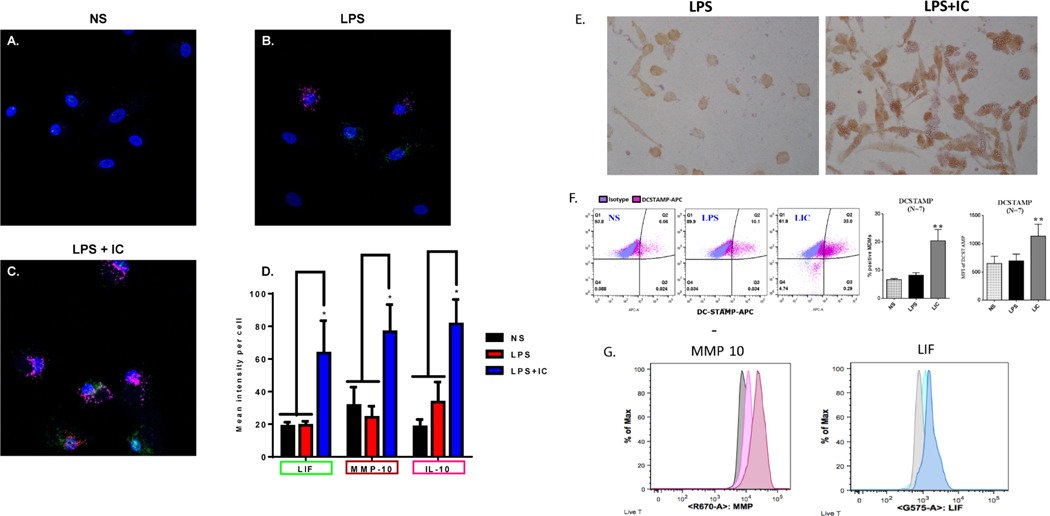
Figure 6. Biomarker identification on R-Mϕ-IC.
RNAscope, a modified fluorescence in situ hybridization technique developed by Advanced Cell Diagnostics, was used to identify R-Mϕ transcriptional markers. Probes for LIF (green), MMP10 (red) and IL-10 (pink) were added to (A) resting non-stimulated macrophages, or those stimulated with (B) LPS or (C) LPS+IC. Representative RNAscope images are shown in panels A-C and the mean intensity per cell ± SEM (n=3) was quantified (D) using Zen Software, expressed as fold change relative to NS (* P-value ≤ 0.05). (E) Monolayers of human macrophages were stimulated with LPS (left) or LPS+ particulate immune complexes (right) and stained with mAb to CD73 followed by HRP-conjugated anti-mouse IgG. (F) Flow cytometry of macrophages stimulated for 16 hours with LPS in the presence or absence of soluble IC (Ova-antiOVA). DC-STAMP expression on non-stimulated (NS), LPS-stimulated (LPS), and LPS+IC-stimulated (LIC) was analyzed. The MFI, and % positive cells are shown (error bars represent SEM, ** P-value≤0.01). (G) Macrophages were stimulated in brefeldin prior to permeabilization, fixation, and staining with MMP10 or LIF. The grey peak represents unstimulated cells, the lightly colored peaks represent LPS stimulation and the darker profiles represent LPS+IC stimulation.

