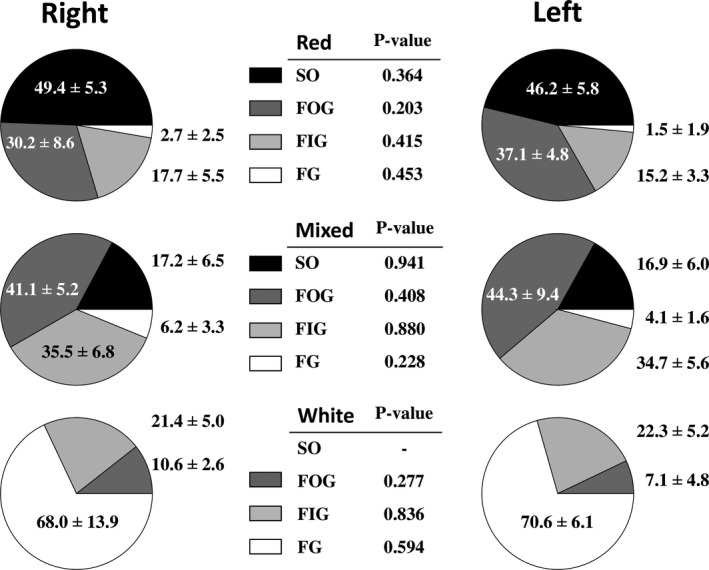
FIGURE 3.

Pie charts showing the percentage of fibre type distribution in red, mixed and white regions of the right and left rat gastrocnemius muscles. p‐values resulting from statistical comparisons between right and left muscles after running paired t‐Student tests are shown for each fibre type in the central tables. Values are mean ± standard deviation. FG, fast glycolytic; FIG, fast intermediate glycolytic; FOG, fast oxidative glycolytic; SO, slow oxidative
