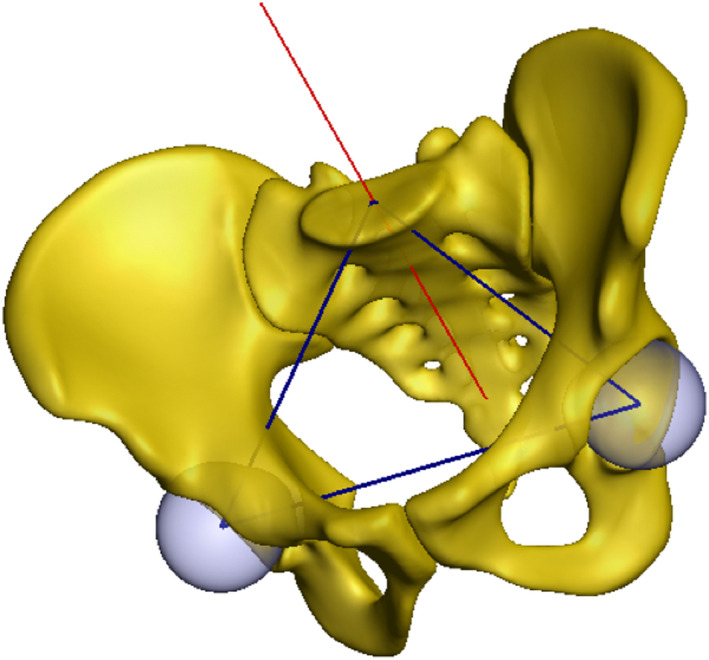
FIGURE 1.

3D statistical model of the pelvic ring. The figure shows the mean model with the perpendicular to the sacral plate at its geographical midpoint (red line), the best‐fit balls inside the acetabular cavity (light blue) and the axis connecting the acetabular centre with the midpoint of the sacral plate as well as the interacetabular axis (blue lines). Based on these lines PI and PI 3D were calculated. 3D, three‐dimensional; PI, pelvic incidence.
