FIGURE 6.

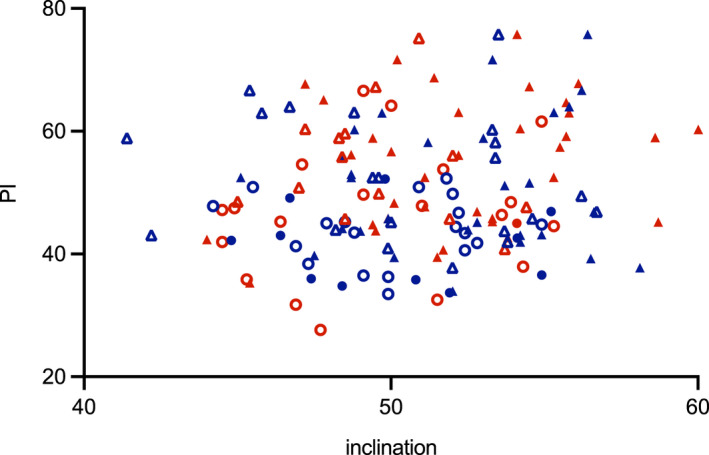
Correlation between inclination and PI; red = female, blue = male, triangle = European, circle = Japanese, filled = ≤65 years, unfilled = >65 years. PI, pelvic incidence.

Correlation between inclination and PI; red = female, blue = male, triangle = European, circle = Japanese, filled = ≤65 years, unfilled = >65 years. PI, pelvic incidence.