Fig. 3.
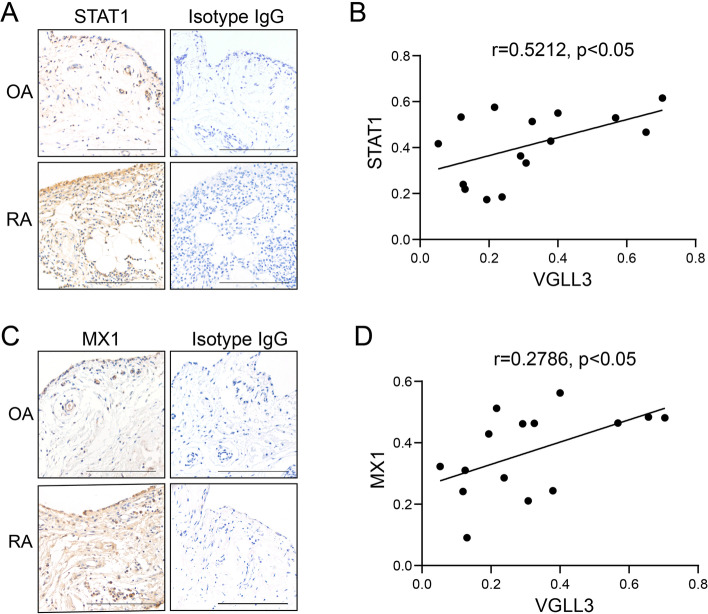
The expression levels of STAT1 and MX1 and their association with VGLL3 expression levels in the synovium of RA and OA patients. a, c Representative images of the expression of STAT1 (a) and MX1 (c) examined by immunohistochemistry staining using anti-STAT1 antibodies, anti-MX1 antibodies, and rabbit IgG (isotype) in RA (n = 10) and OA (n = 5) synovial tissues. Scale bar, 500 μm. b The association between the expression levels of STAT1 and VGLL3 in the synovium of ten RA patients and five OA patients. d The association between the expression levels of MX1 and VGLL3 in the synovium of ten RA patients and five OA patients

