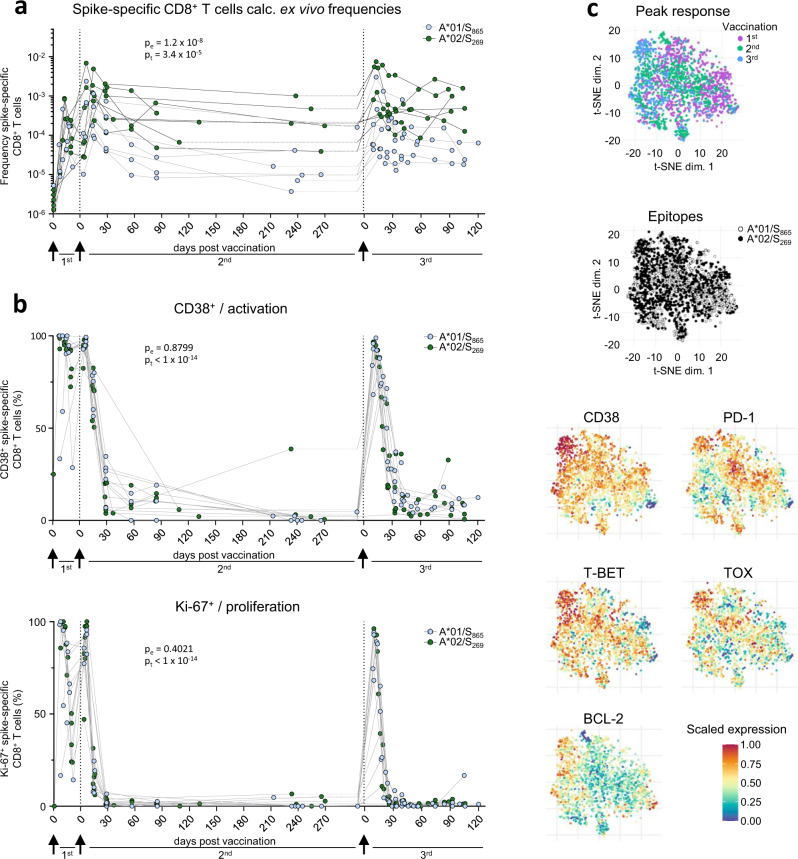
Fig. 1. Cellular and humoral effector response after the 3rd vaccine dose.
Calculated ex vivo frequencies of spike-specific CD8+ T cells throughout 1st, 2nd and 3rd vaccination (a). Ki-67,and CD38 expression within spike-specific non-naïve CD8+ T cells (b). t-SNE representation of flow cytometry data comparing A*01/S865- and A*02/S269-specific CD8+ T cells at peak response after 1st, 2nd and 3rd vaccination. Expression levels of CD38, T-BET, BCL-2, PD-1 and TOX are depicted (c). Statistical significance was determined by two-way ANOVA with main model (a, b) comparing the effects of targeted epitopes (pe) and of the time course (pt). Source data are provided as a Source Data file.

