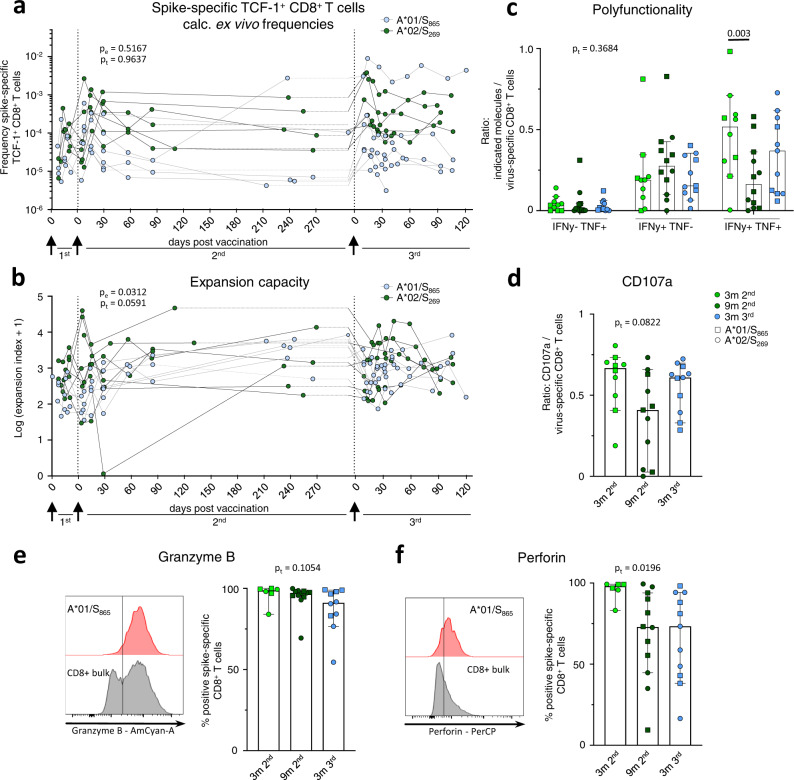
Fig. 4. Reactivation capacity of spike-specific CD8+ T cells before and after the 3rd vaccine dose.
Calculated ex vivo frequencies of TCF-1+ non-naive spike-specific CD8+ T cells (a). Expansion capacity of spike-specific CD8+ T cells over 14 days of in vitro expansion throughout 1st, 2nd and 3rd vaccination (b). Percentage of IFNγ and TNF (c), and CD107a (d) producing CD8+ T cells upon peptide stimulation related to the percentage of spike-specific CD8+ T cells from all CD8+ T cells at 3 (n = 10) and 9 (n = 12 for c, n = 11 for d) months post 2nd, and 3 (n = 11) months post 3rd vaccination after in vitro expansion. Median values are depicted with 95% confidence interval error bars. Expression of Granzyme B (e) and Perforin (f) of spike-specific CD8+ T cells at 3 (n = 6) and 9 (n = 12) months post 2nd, and 3 months (n = 10 for e, n = 11 for f) post 3rd vaccination after in vitro expansion with representative histograms. Median values are depicted with 95% confidence interval error bars. Statistical significance was calculated by two-way ANOVA with main model (a, b) to compare the effects of targeted epitopes (pe) and time course (pt), two-way ANOVA with full model and Tukey’s multiple comparison test (c), and Kruskal-Wallis test (d, e, f) to examine the effect of sampling time on functionality (pt). Source data are provided as a Source Data file.

