
Figure 3.
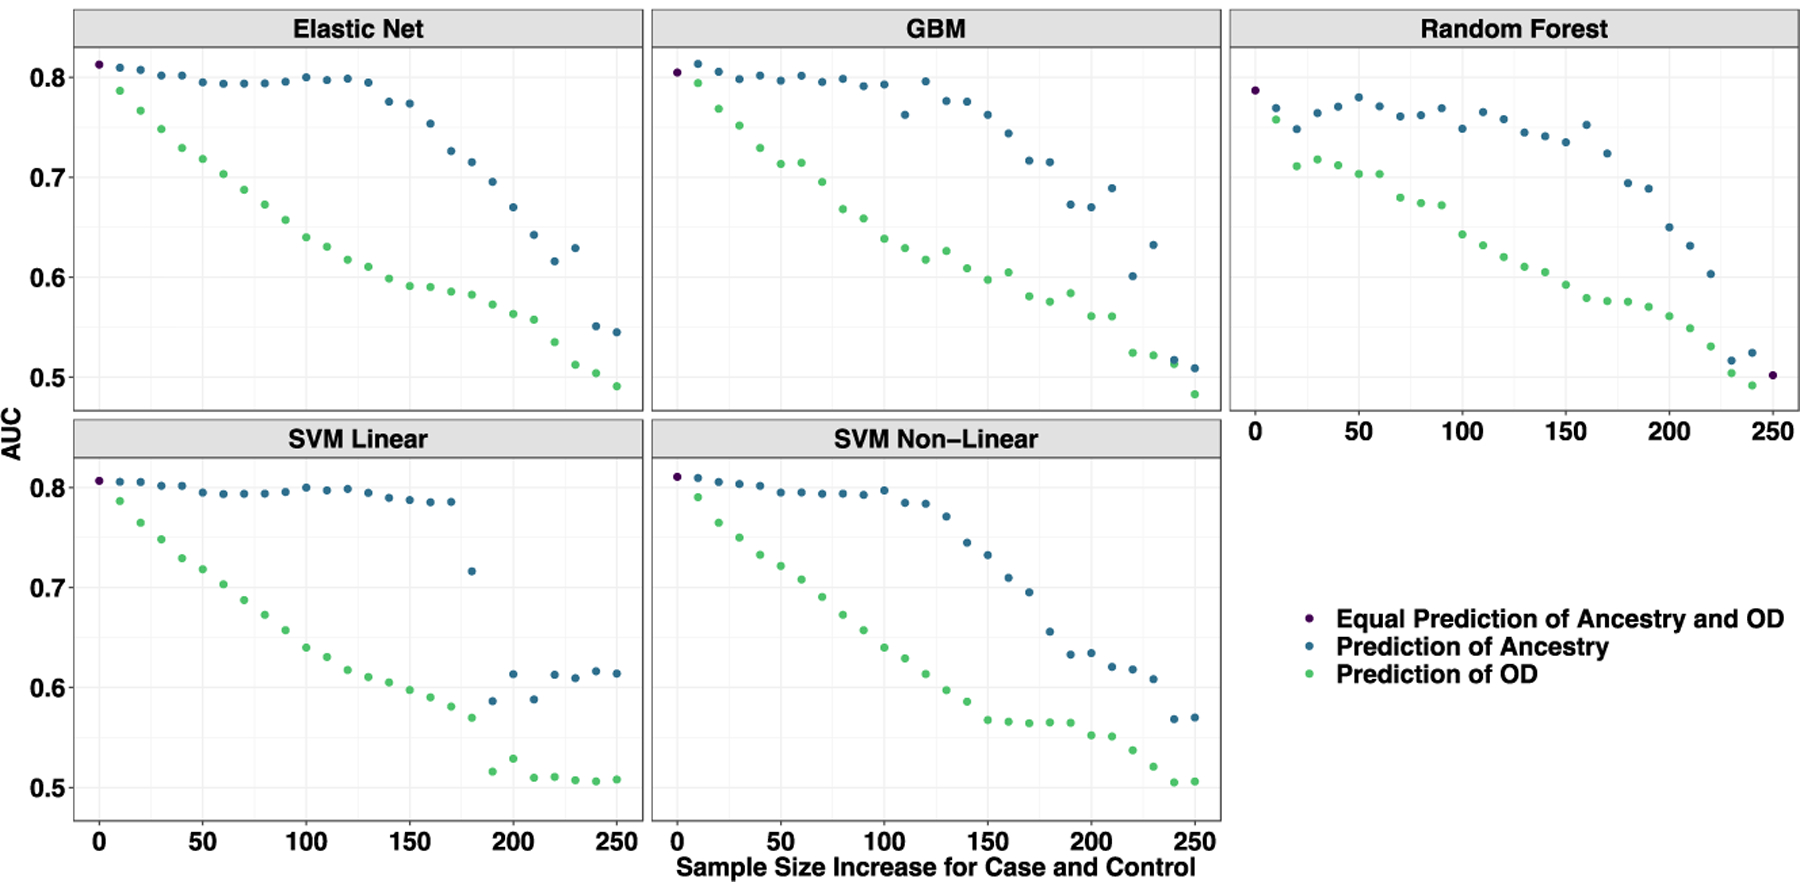
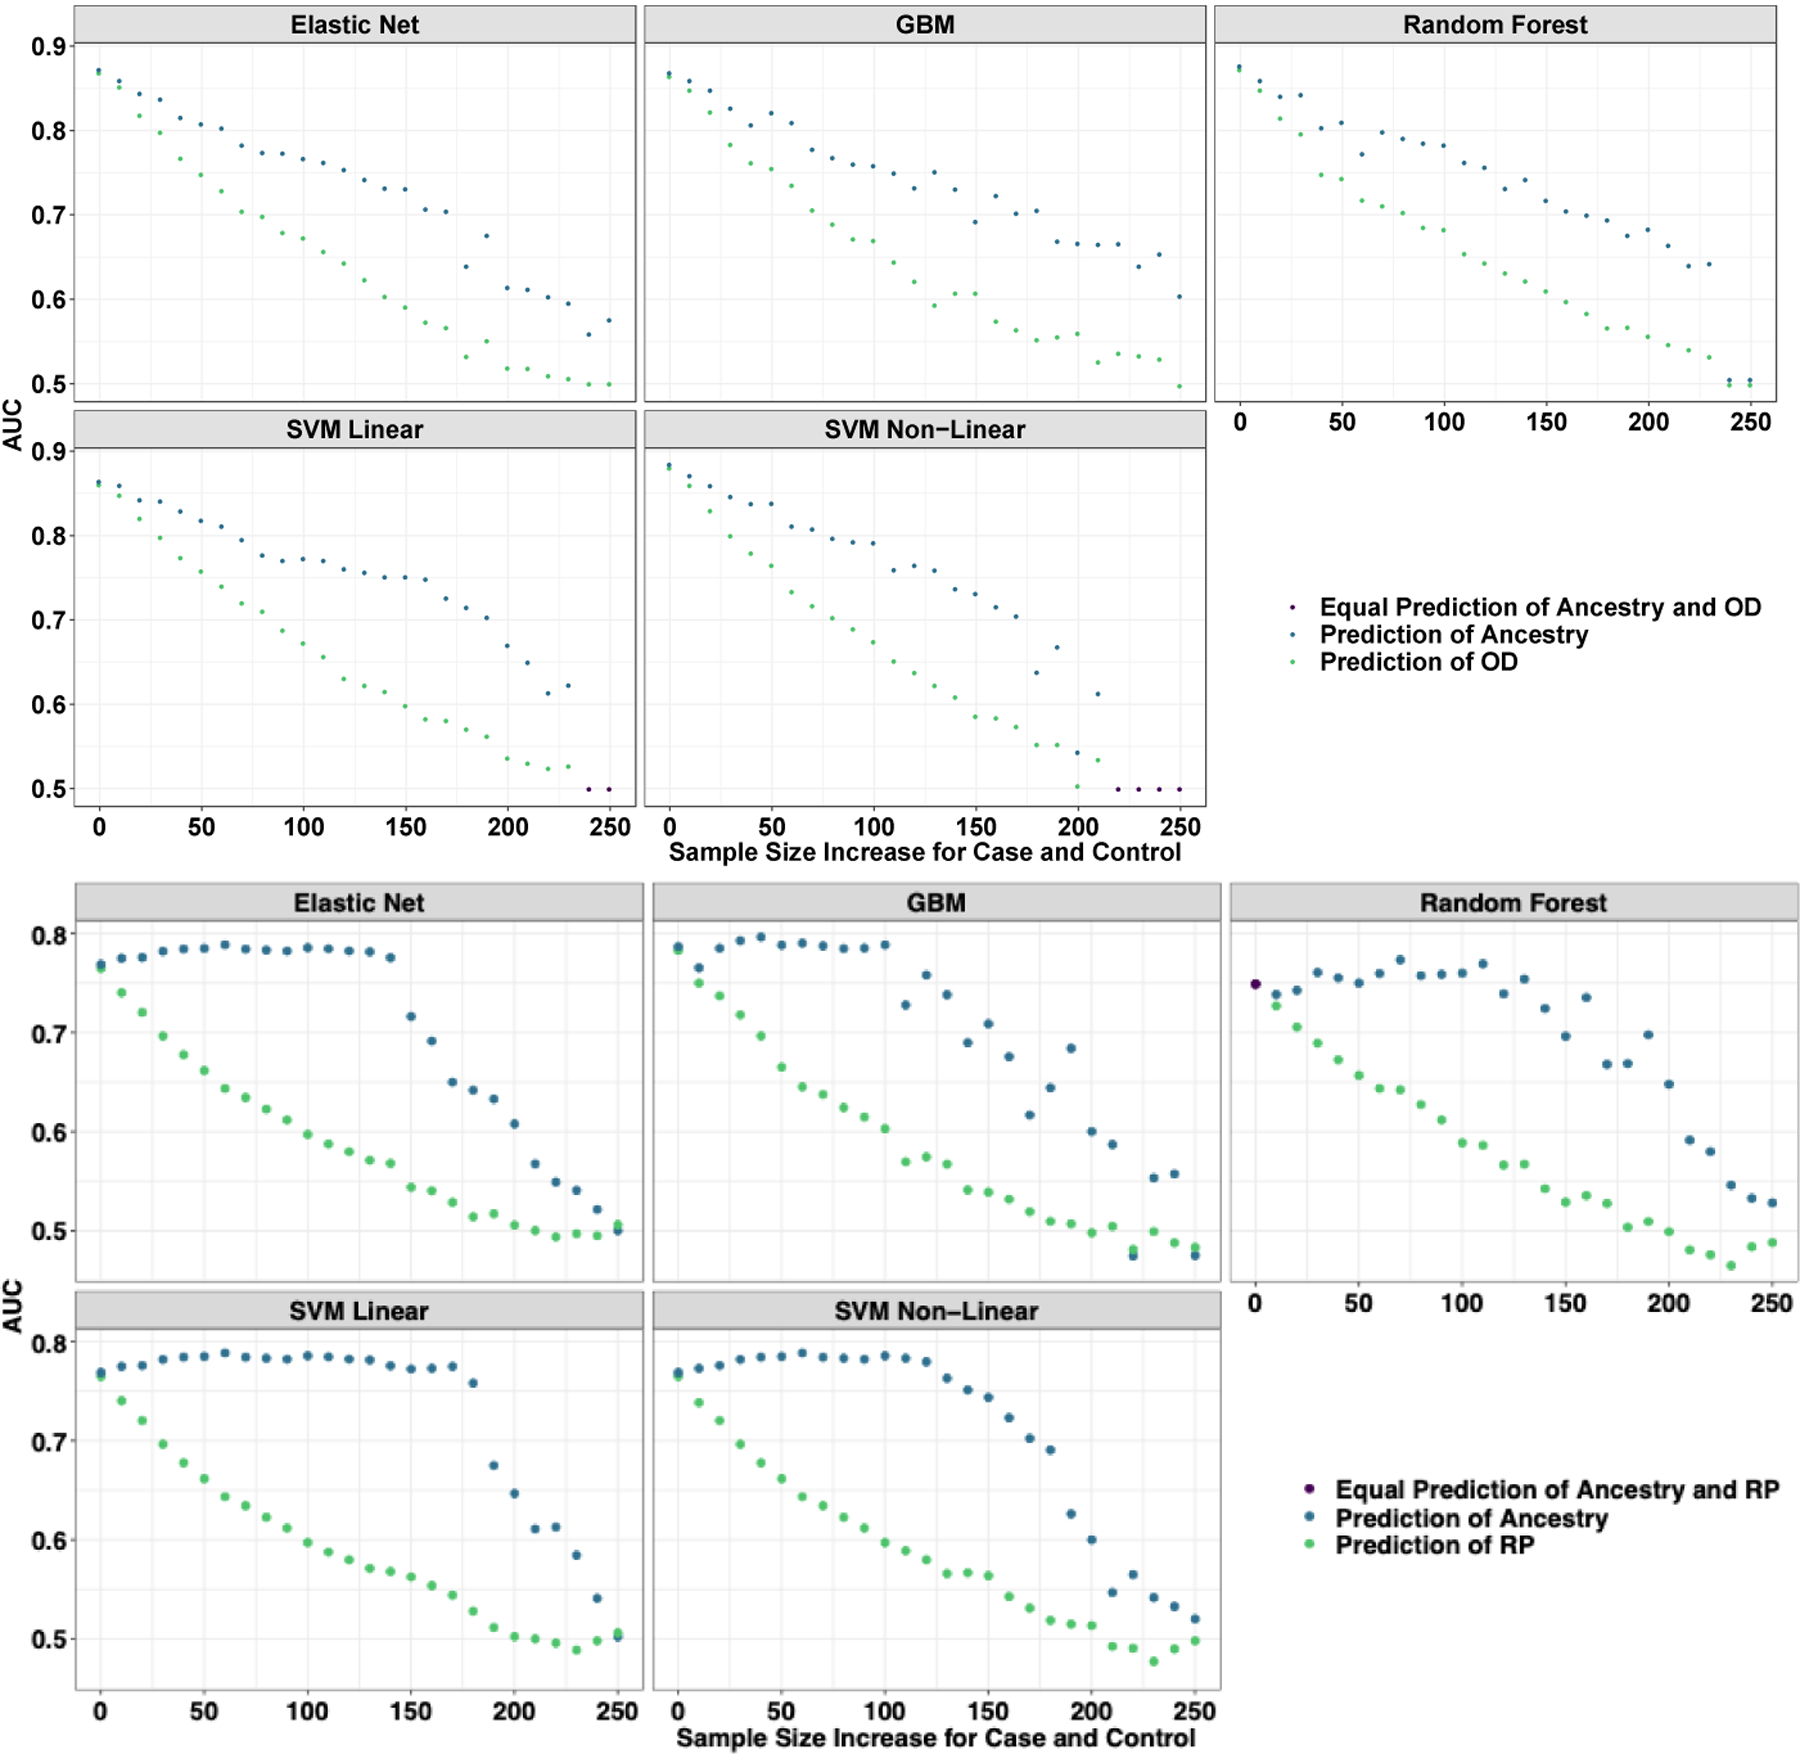
Learning curves from models trained to predict opioid dependence from 16 “reward-related” SNPs (Donaldson et al., 2017). The curves are plotted by AUC based on their prediction of opioid dependence (orange) and geographic ancestry (blue) as the samples start from complete population confounding become more balanced by major geographic ancestry (European American or African American) until completely balanced. Each data point represents a larger and more balanced sample size by adding 20 individuals, 10 African American cases and 10 European American controls (as measured on the x-axis). (A) A priori Candidate SNPs predicting Opioid Use Disorder. (B) Set 1 of randomly selected (MAF matched) SNPs predicting Opioid Use Disorder. (C) Set 1 of Random (MAF match) SNPs predicting a random phenotype binary phenotype. Across all perspectives, the prediction is entirely driven by major geographic ancestry.