Figure 4.
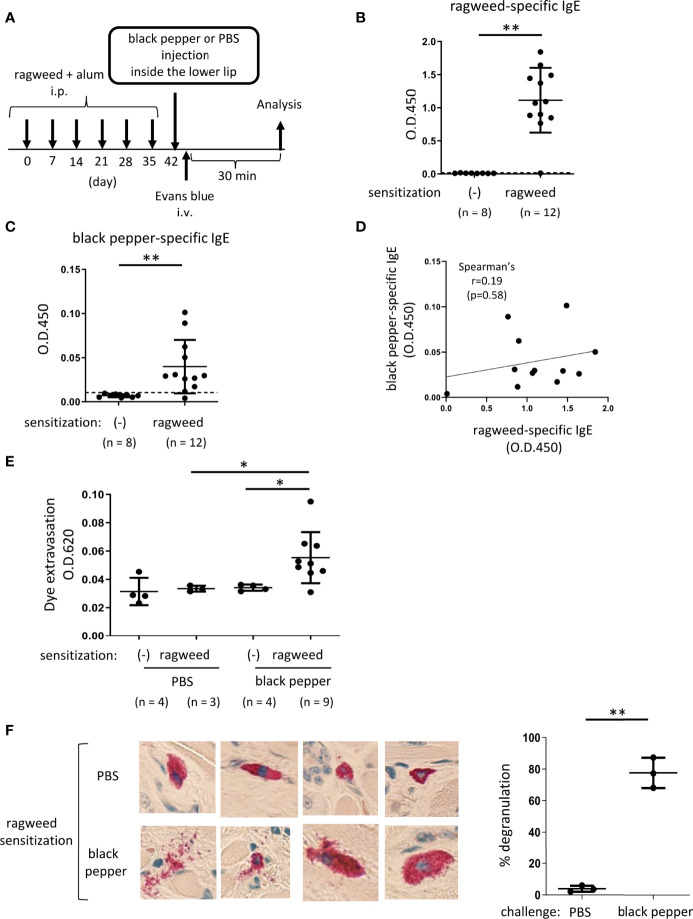
Ragweed pollen cross-reacts with black pepper in murine model of OAS. (A) A schematic representation of murine model of OAS. WT mice intraperitoneally sensitized with ragweed pollen before stimulation with black pepper or PBS as a control. (B-D) Serum levels of ragweed-specific (B) and black pepper-specific IgE (C) from ragweed-sensitized mice at day 42 (n = 12) or non-sensitized control mice (n = 8). (B and C) A positivity threshold (mean + 2SD in non-sensitized mice) is shown as a dotted line. Data are presented as mean ± SD. Data are representative of two independent experiments. Welch’s t-test. **P < 0.01. (D) No correlation between serum levels of ragweed-specific IgE and black pepper-specific IgE from ragweed-sensitized mice (n =12). Spearman’s correlation test. (E) Quantification of the Evans blue dye that extravasated into the neck skin from ragweed-sensitized mice stimulated by black pepper extract (n = 9) or PBS (n = 3) or from non-sensitized control mice stimulated by black pepper extract (n = 4) or PBS (n = 4). Data are presented as mean ± standard deviation. Data are representative of two independent experiments. Brown-Forsythe and Welch ANOVA with Dunnett T3 multiple comparisons. *P < 0.05. (F) Representative images of images of chloroacetate esterase-stained mast cells in tissue sections in the inside of the lower lip from ragweed-sensitized mice stimulated by black pepper extract (left/lower panel) or PBS (left/upper panel). Percentages of degranulated mast cells were shown (right). n = 3 per each group. Data are presented as mean ± SD. Data are representative of two independent experiments. Welch’s t-test. **P < 0.01.

