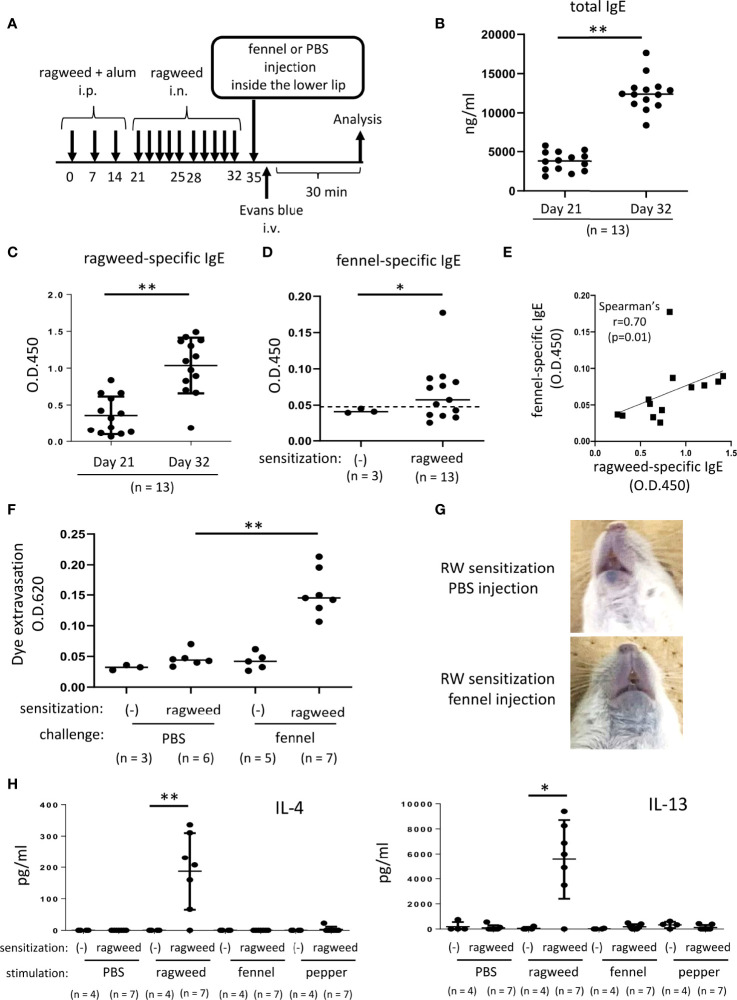
Figure 6.
Stimulation with fennel extracts induced mast cell-dependent OAS in mice intraperitoneally and intranasally sensitized with ragweed pollen. (A) A schematic representation of murine model of OAS. WT mice intraperitoneally and intranasally sensitized with ragweed pollen before stimulation with fennel or PBS as a control. (B-D) Serum levels of total IgE (B) and ragweed-specific IgE (C) from ragweed-sensitized mice (n = 13) at day 21 and at day 32. (D) Serum levels of fennel-specific IgE from ragweed-sensitized mice (n = 13) at day 32 or from non-sensitized control mice (n = 3). A positivity threshold (mean + 2SD in non-sensitized mice) is shown as a dotted line. Data are expressed as mean ± SD. Data are representative of two independent experiments. Welch’s t-test. *P < 0.05; **P < 0.01. (E) A weak positive correlation between serum levels of ragweed-specific IgE and fennel-specific IgE from ragweed-sensitized mice (n = 13). Spearman’s correlation test. (F) Quantification of the Evans blue dye that extravasated into the neck skin from ragweed-sensitized mice stimulated by fennel extract (n = 7) or PBS (n = 6) or from non-sensitized control mice stimulated by fennel extract (n = 5) or PBS (n = 3). Data are expressed as mean ± SD. Data are representative of two independent experiments. Brown-Forsythe and Welch ANOVA with Dunnett T3 multiple comparisons. **P < 0.01. (G) Representative pictures of the neck skin from ragweed-sensitized mice stimulated by fennel extracts (lower panel) or PBS (upper panel). Data are representative of two independent experiments. (H) Levels of IL-4 (left) and IL-13 (right) in the culture supernatants from cervical LN cells from ragweed-sensitized mice (n = 7) or non-sensitized control mice (n = 4) in response to ragweed pollen, fennel, or black pepper extract. Data are expressed as mean ± SD. Data are representative of two independent experiments. Brown-Forsythe and Welch ANOVA with Dunnett T3 multiple comparisons. *P < 0.05; **P < 0.01.

