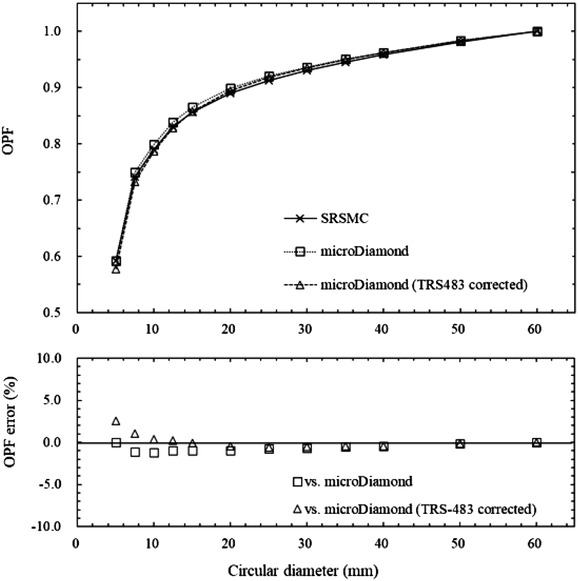
FIGURE 3.

Comparison of the output factors (OPFs) measured by SRS MapCHECK (SRSMC), the microDiamond detector, and the microDiamond detector after the field output correction factors of TRS‐483 were applied. The upper graph shows the OPF measurement results, and the lower graph shows the percentage errors between the OPF measured by SRSMC and those measured by the microDiamond detector and the microDiamond detector after TRS‐483 corrections. Each measured value had an extremely small error range; thus we omitted error bars from the plots
