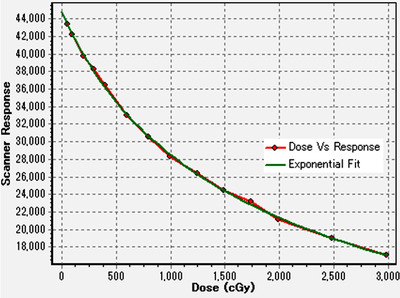
FIGURE 7.

Dose calibration curve for a GAFchromic EBT‐XD film created in the SNC Patient software. The dot marks with red line represent the scanned data, and the green exponential fit curve was used for the conversions from the scanner response values to the doses for the dose distribution verification
