
FIGURE 3.
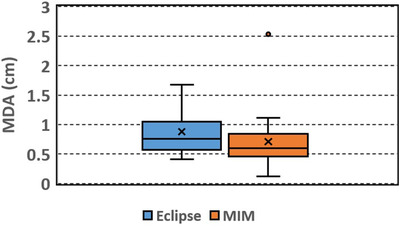
Box plot of mean distance to agreement (MDA) between the automatically segmented (Eclipse, MIM) and manually delineated liver contours
Official websites use .gov
A
.gov website belongs to an official
government organization in the United States.
Secure .gov websites use HTTPS
A lock (
) or https:// means you've safely
connected to the .gov website. Share sensitive
information only on official, secure websites.
Box plot of mean distance to agreement (MDA) between the automatically segmented (Eclipse, MIM) and manually delineated liver contours