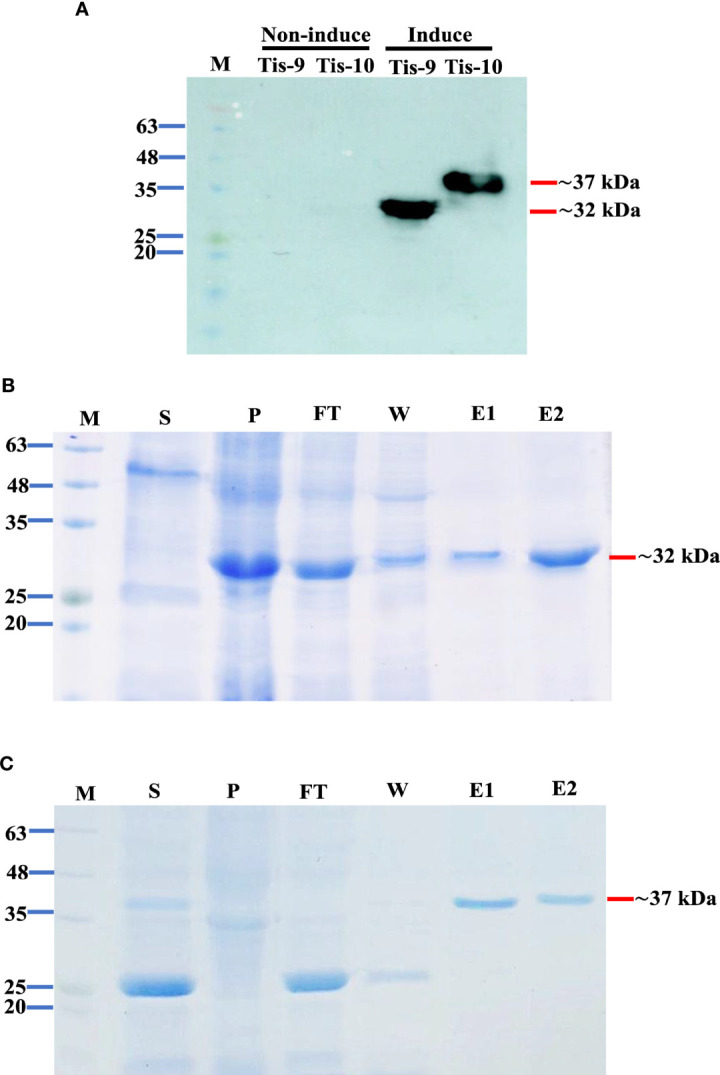
Figure 2.

Expression and purification of Tis9 and Tis10 proteins. (A) Western blot analysis of both proteins from the E. coli expression system. Tis9 and Tis10 proteins expressed approximately 32 kDa and 37 kDa, respectively (Lane M: prestained protein marker). (B, C) SDS-PAGE analysis of (B) Tis9 and (C) Tis10 proteins purification with coomassie blue staining. (Lane M: prestained protein marker; Lane S: supernatant; Lane P: precipitation of the E. coli was induced; Lane F: unbound flowthrough; Lane W: wash fraction; Lanes: E1-E2 = elute fractions.
