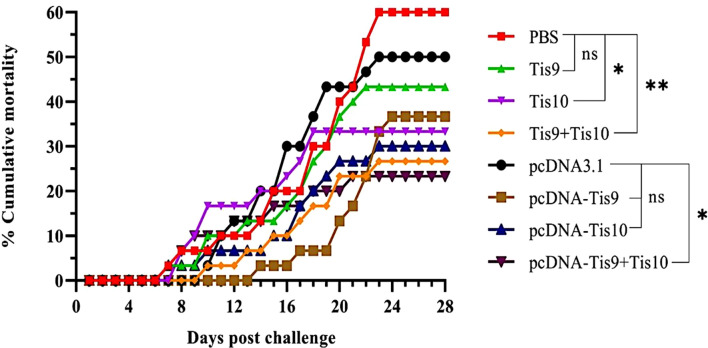
Figure 3.
Cumulative mortality curves of the recombinant protein vaccines (Tis9, Tis10 and Tis9+Tis10 groups) and DNA vaccines (pcDNA-Tis9, pcDNA-Tis10 and pcDNA-Tis9+Tis10 groups) after challenge with 1 x 10⁵ TCID50 of TiLV. Differences among the groups were analyzed using one-way ANOVA and Tukey’s post hoc tests. Statistical significance is indicated by single asterisk (*, P < 0.05) or double asterisks (**, P < 0.01) or ns (not significant) compared to the PBS or pcDNA3.1 (negative control) groups at the termination day (day 28).

