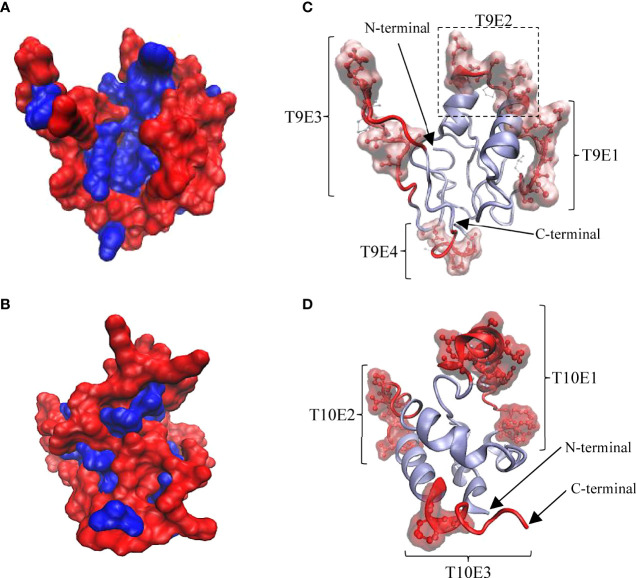
Figure 5.
3D structure of Tis9 and Tis10 proteins showing their surface polarity, linear and conformational B cell epitope regions and relative proportions of amino acid residues in conformational epitopes. (A) Tis9 and (B) Tis10 models are shown in surface presentation, nonpolar residues (blue) buried in the core, whereas polar residues (red) tend to occur at the surface of proteins. (C and D) Predicted linear epitope and conformational epitope from the ElliPro results. Polar surface regions in (A) and (B) displayed linear epitopes (represented as red ribbon) and conformational epitopes (represented as red CPK along with surface structure on the Tis9 (C) and Tis10 (D) models. Their N-terminus and C-terminus are indicated by arrows.

