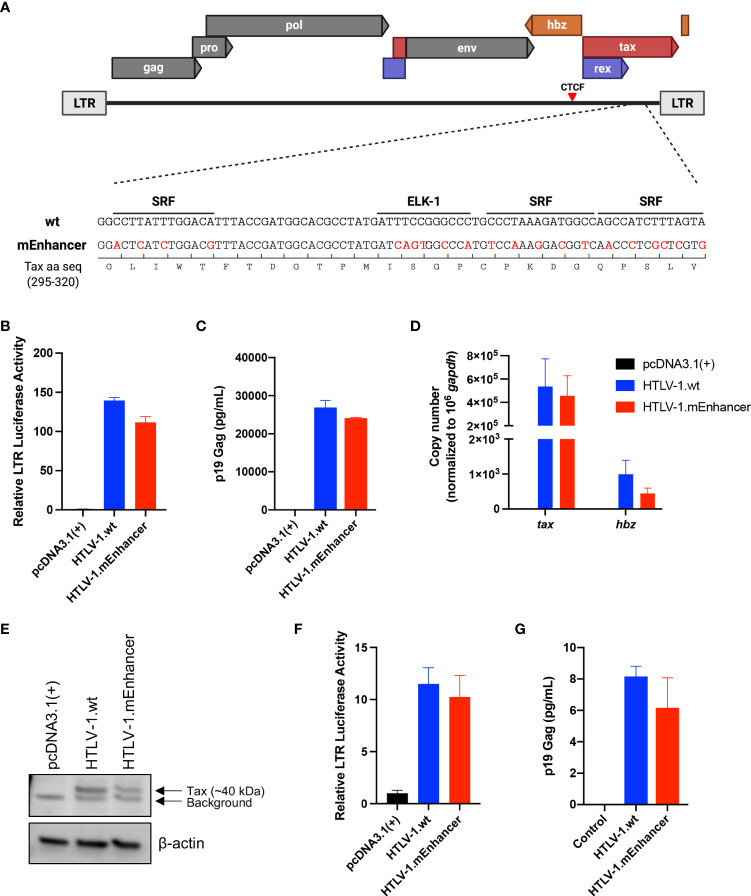
Figure 1.
Generation and characterization of HTLV-1.mEnhancer proviral clone in vitro. The mEnhancer region was cloned into the HTLV-1 proviral plasmid ACHneo by overlap extension PCR. (A) Alignment of the mEnhancer region and the wild-type region from the HTLV-1 molecular clone ACHneo. Mutations span the consensus binding sequences for the transcription factors SRF and ELK-1. (B) HEK293T cells were co-transfected with the pcDNA3.1(+) empty vector, HTLV-1.wt, or mutant (HTLV-1.mEnhancer) proviral plasmid, an HTLV-1 LTR-firefly luciferase construct, and a TK-Renilla luciferase construct. 72h post-transfection, cells and supernatant were collected for dual luciferase assay and ELISA to detect HTLV-1 p19 Gag (C), respectively. Relative LTR luciferase activity was determined by normalizing firefly luciferase relative light units to Renilla, and the empty vector control was set as 1. Each condition was performed in duplicate. (D) RNA was extracted from transfected cells for cDNA synthesis, followed by qPCR to detect tax and hbz mRNA levels. Copy number is shown normalized to 1 x 10⁶ gapdh copies. (E) Cells pellets from transfected cells were lysed and total protein was quantified by BCA assay. Equivalent amounts of protein were subjected to SDS-PAGE and immunoblotting to detect Tax expression. β-actin was used as a loading control. Arrows are used to distinguish bands representative of Tax protein expression from background. (F) The HTLV-1-negative T-cell line, Jurkat, was co-transfected with the pcDNA3.1(+) empty vector, HTLV-1.wt, or mutant (HTLV-1.mEnhancer) proviral plasmid, an HTLV-1 LTR-firefly luciferase construct, and a TK-Renilla luciferase construct. 72h post-transfection, cells and supernatant were collected for dual luciferase assay and ELISA to detect HTLV-1 p19 Gag (G), respectively. Relative LTR luciferase activity was determined as described above. Each condition was performed in duplicate. Graphs represent data generated from duplicate samples and error bars represent standard deviation (SD). Statistical significance was determined by unpaired t test.

