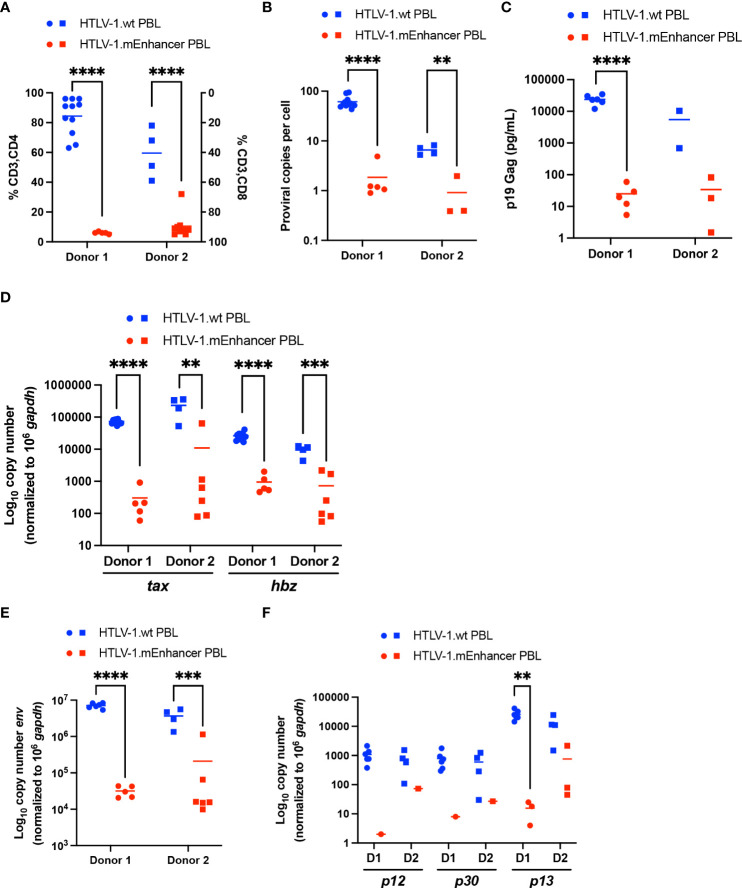
Figure 7.
Loss of HTLV-1 enhancer element alters immortalization phenotype and viral gene expression in vitro. Newly immortalized PBL cell lines from two separate co-culture experiments with different PBMC donors were characterized in vitro. Cell lines from Donor 1 are represented by circles, and cell lines from Donor 2 are represented by squares. (A) T-cell phenotypic analysis of HTLV-1.wt (Donor 1 n=11; Donor 2 n=4) or HTLV-1.mEnhancer PBLs (Donor 1 n=5; Donor 2 n=9) was performed by flow cytometry. (B) Genomic DNA was extracted from PBL cell lines and used for qPCR to detect proviral load using primers targeting HTLV-1 Gag/pol (HTLV-1.wt: Donor 1 n=11, Donor 2 n=4; HTLV-1.mEnhancer: Donor 1 n=5, Donor 2 n=3). (C) Approximately 5 x 10⁵ PBLs were plated in 1 mL media. Supernatant was collected from each well after 72h and analyzed by p19 Gag ELISA. (HTLV-1.wt: Donor 1 n=6, Donor 2 n=2; HTLV-1.mEnhancer: Donor 1 n=5, Donor 2 n=3) (D) RNA was extracted from each PBL cell line, and subjected to cDNA synthesis followed by qPCR to detect tax and hbz gene expression. Data are shown normalized to 1 x 10⁶ hgapdh copies (HTLV-1.wt: Donor 1 n=11, Donor 2 n=4; HTLV-1.mEnhancer: Donor 1 n=5, Donor 2 n=6) (E, F) PBL RNA was isolated and used for cDNA synthesis. Pre-amplification was performed, followed by qPCR to determine expression of env, p12, p30, and p13 viral transcripts. Data are shown normalized to 1 x 10⁶ hgapdh copies. Values of zero for cell lines with undetectable transcripts are not plotted or included in the statistical analyses (HTLV-1.wt: Donor 1 n=6, Donor 2 n=4; HTLV-1.mEnhancer: Donor 1 n=5, Donor 2 n=6). Donor 1 and Donor 2 are abbreviated as D1 and D2, respectively, in (E). Statistical significance was determined by unpaired t test. **P ≤ 0.01, ***P ≤ 0.001, ****P ≤ 0.0001.

