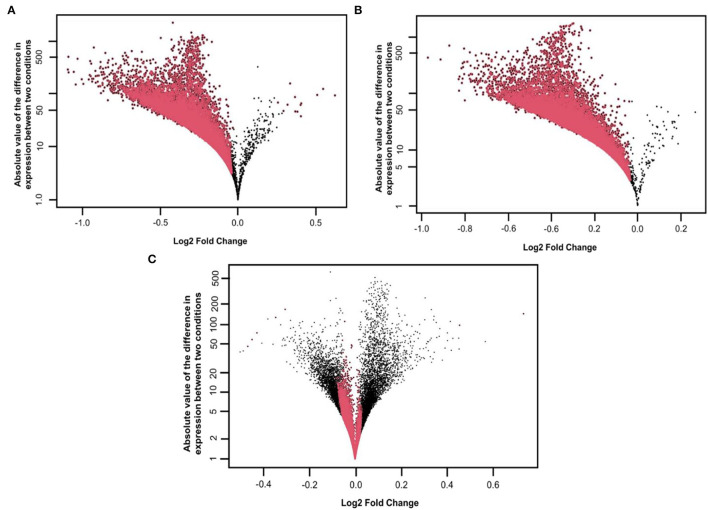
Figure 2.
Distribution of M, D values and differentially expressed features on the (A) symAD vs. Control samples (B) symAD vs. AsymAD samples after applying the NOISeqBio function. Differentially expressed genes are shown in red, while M and D values are in Black, and (C) MD plot of AsymAD vs. control samples (GSE118553), showing the distribution of differentially expressed features of genes on a log scale. Red dots correspond to differentially expressed genes with significant probability p-values (>0.8).

