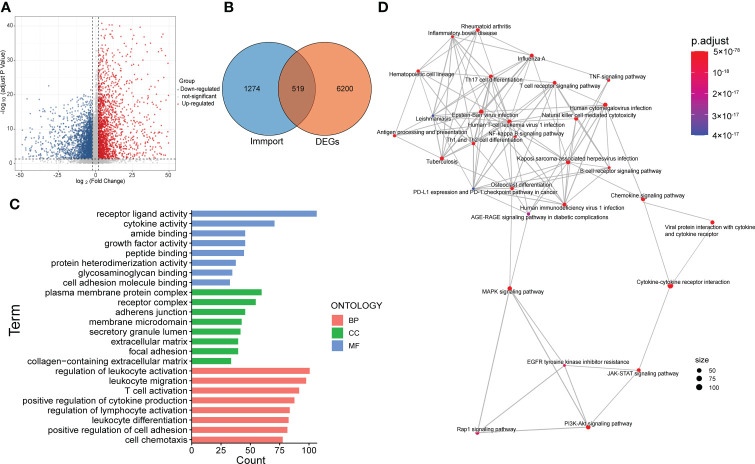
Figure 3.
Screening and functional enrichment analysis of immune-related DEGs. (A) Volcano map showed the DEGs between cluster 3 and cluster 1. (B) Venn diagram displayed the amount of immune-related DEGs. (C) Top 8 items of molecular function (MF), cellular component (CC) and biological process (BP) of GO analysis. (D) The result of KEGG pathway analysis.

